The Second Vector Borne Disease Surveillance Workshop
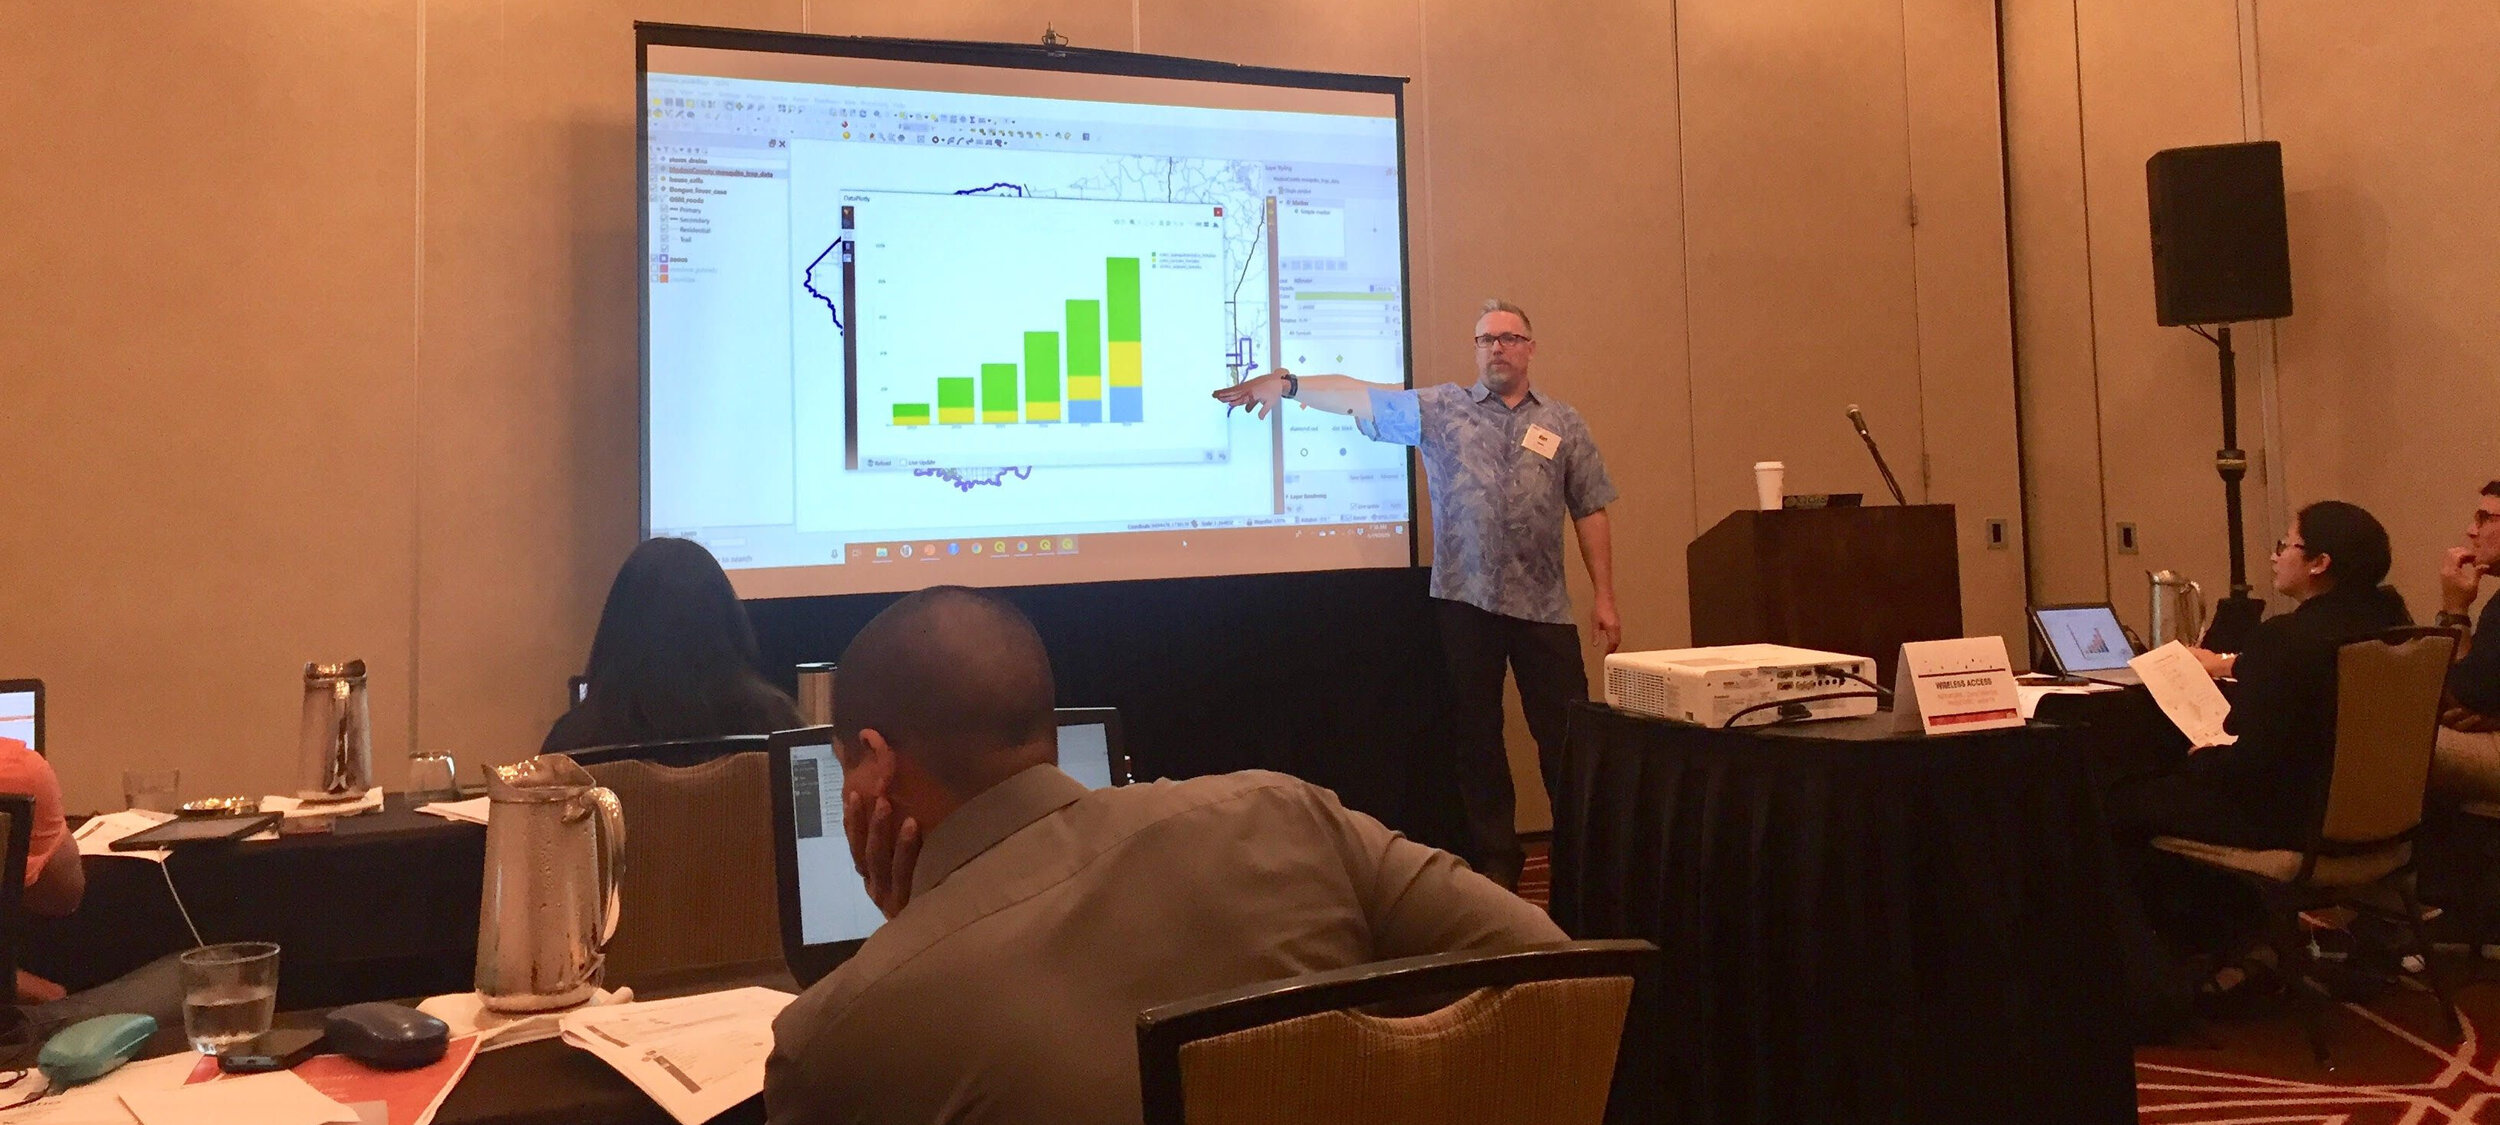
On June 18 & 19, 2019, eight state based health officials took the second Vector Borne Disease Surveillance workshop in Providence, Rhode Island. This was the second of two 2-day workshops aimed specifically at tackling the spread of diseases like Dengue fever, West Nile and Zika viruses. As with the first one, this was a Community Health Maps training specifically designed to demonstrate how to collect and work with geographic data related to vector borne diseases, i.e. those that are transmitted to humans via other animals such as mosquitoes. Attendees represented health departments in: Colorado, Georgia, Kansas, Louisiana, Mississippi, New Mexico, Virginia and Guam.Again this workshop was a team effort. The training was organized by the Association of State and Territorial Health Officials (ASTHO). Participants attendance was funded by CDC’s National Center for Emerging and Zoonotic Infectious Diseases. Travel for the trainers was funded by the National Library of Medicine, (funding for the workshop is provided under a sub-award from the National Library of Medicine to ICF International). This particular CHM workshop was taught in conjunction with ASTHO’s State Environmental Health Directors (SEHD) Peer Network Annual Meeting.After an introduction to the Community Health Maps project - it's origins, workflow and examples of past projects - participants learned to create a data collection form and use their smartphones to map features (trees, signs, benches etc...) around the conference site using Fulcrum.For the remainder of the first day, the group took the data they collected earlier and imported into QGIS. In this section they became familiar with QGIS and how to symbolize layers and make a print map. In addition to the data collected on site, we worked with mosquito data acquired courtesy of Dr. Chris Barker covering Madera County, CA. The data included mosquito trap results over five years, virus testing, mosquito biting complaints, storm drains, parcel boundaries, roads and a hypothetical case of Dengue fever.The second day focused on generating vector borne disease surveillance products. The participants:A) generated trend graphs of mosquito populations through time via the QGIS Data Plotly plugin,
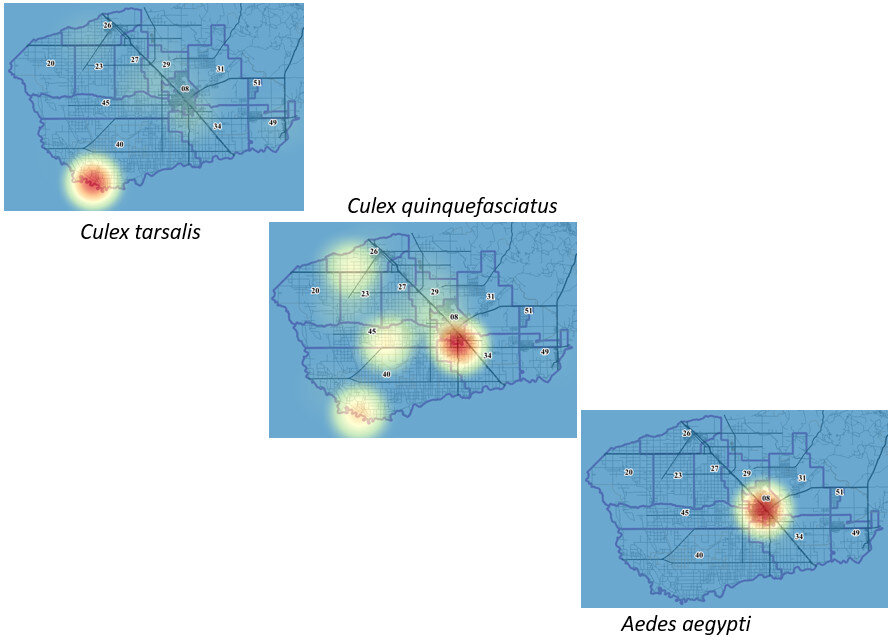
 B) generated heatmaps of mosquito populations,
 C) calculated the minimum infection rate per year for West Nile and St. Louis Encephalitis viruses,
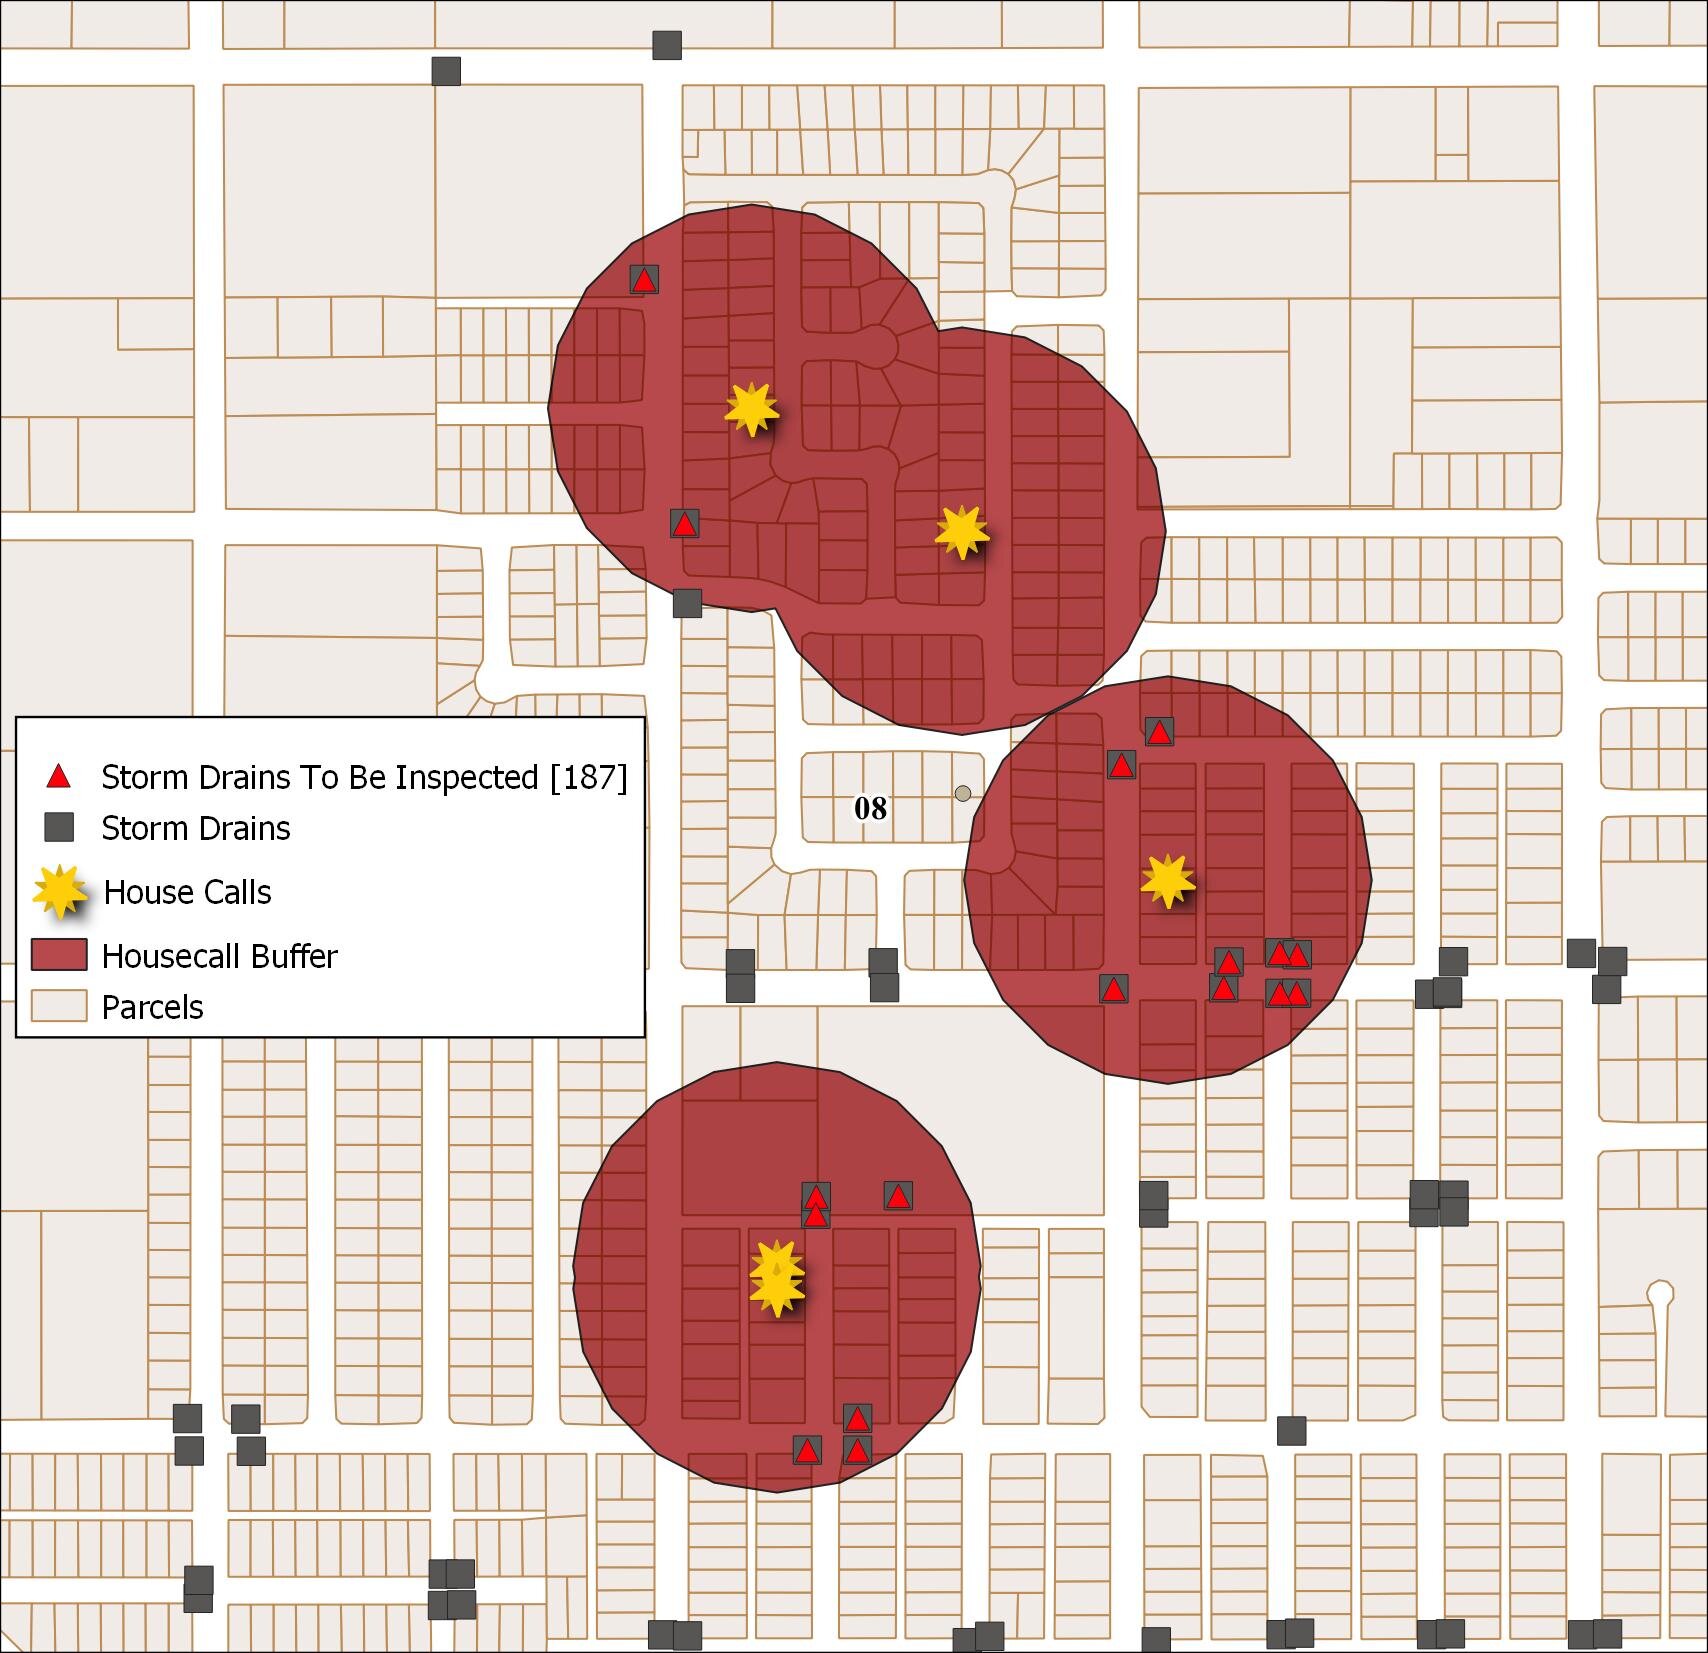
 D) identified potential mosquito sources to be inspected (storm drains) using a combination of a buffer operation (done against mosquito complaints with the distance the species is known to be able to travel) and select by location against storm drains,
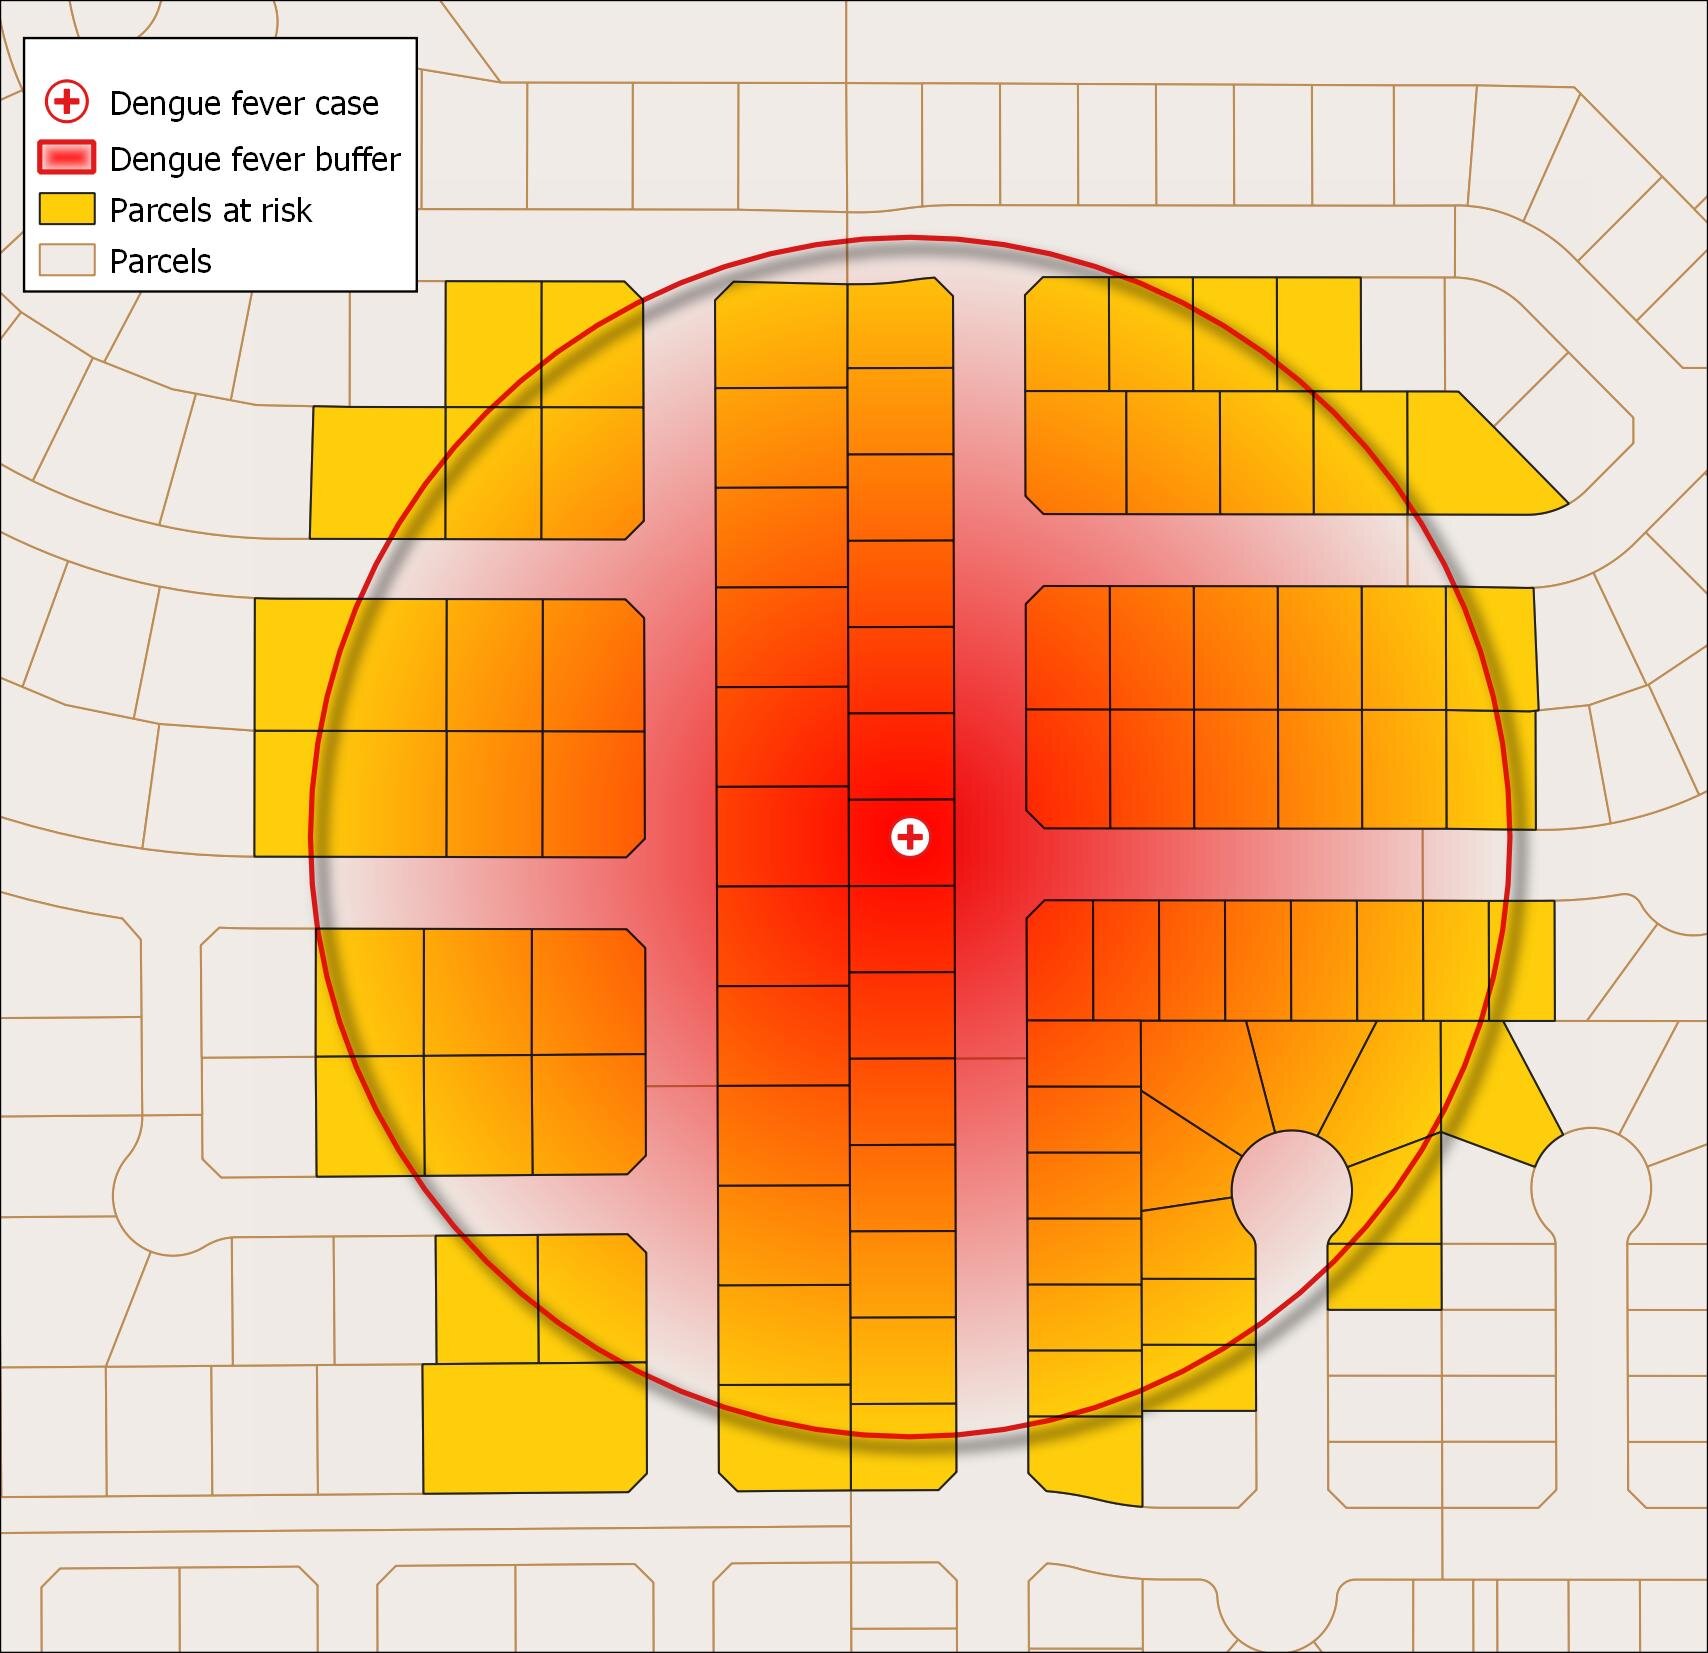
 E) identified parcels at risk due to their proximity to a fictional outbreak of Dengue Fever,
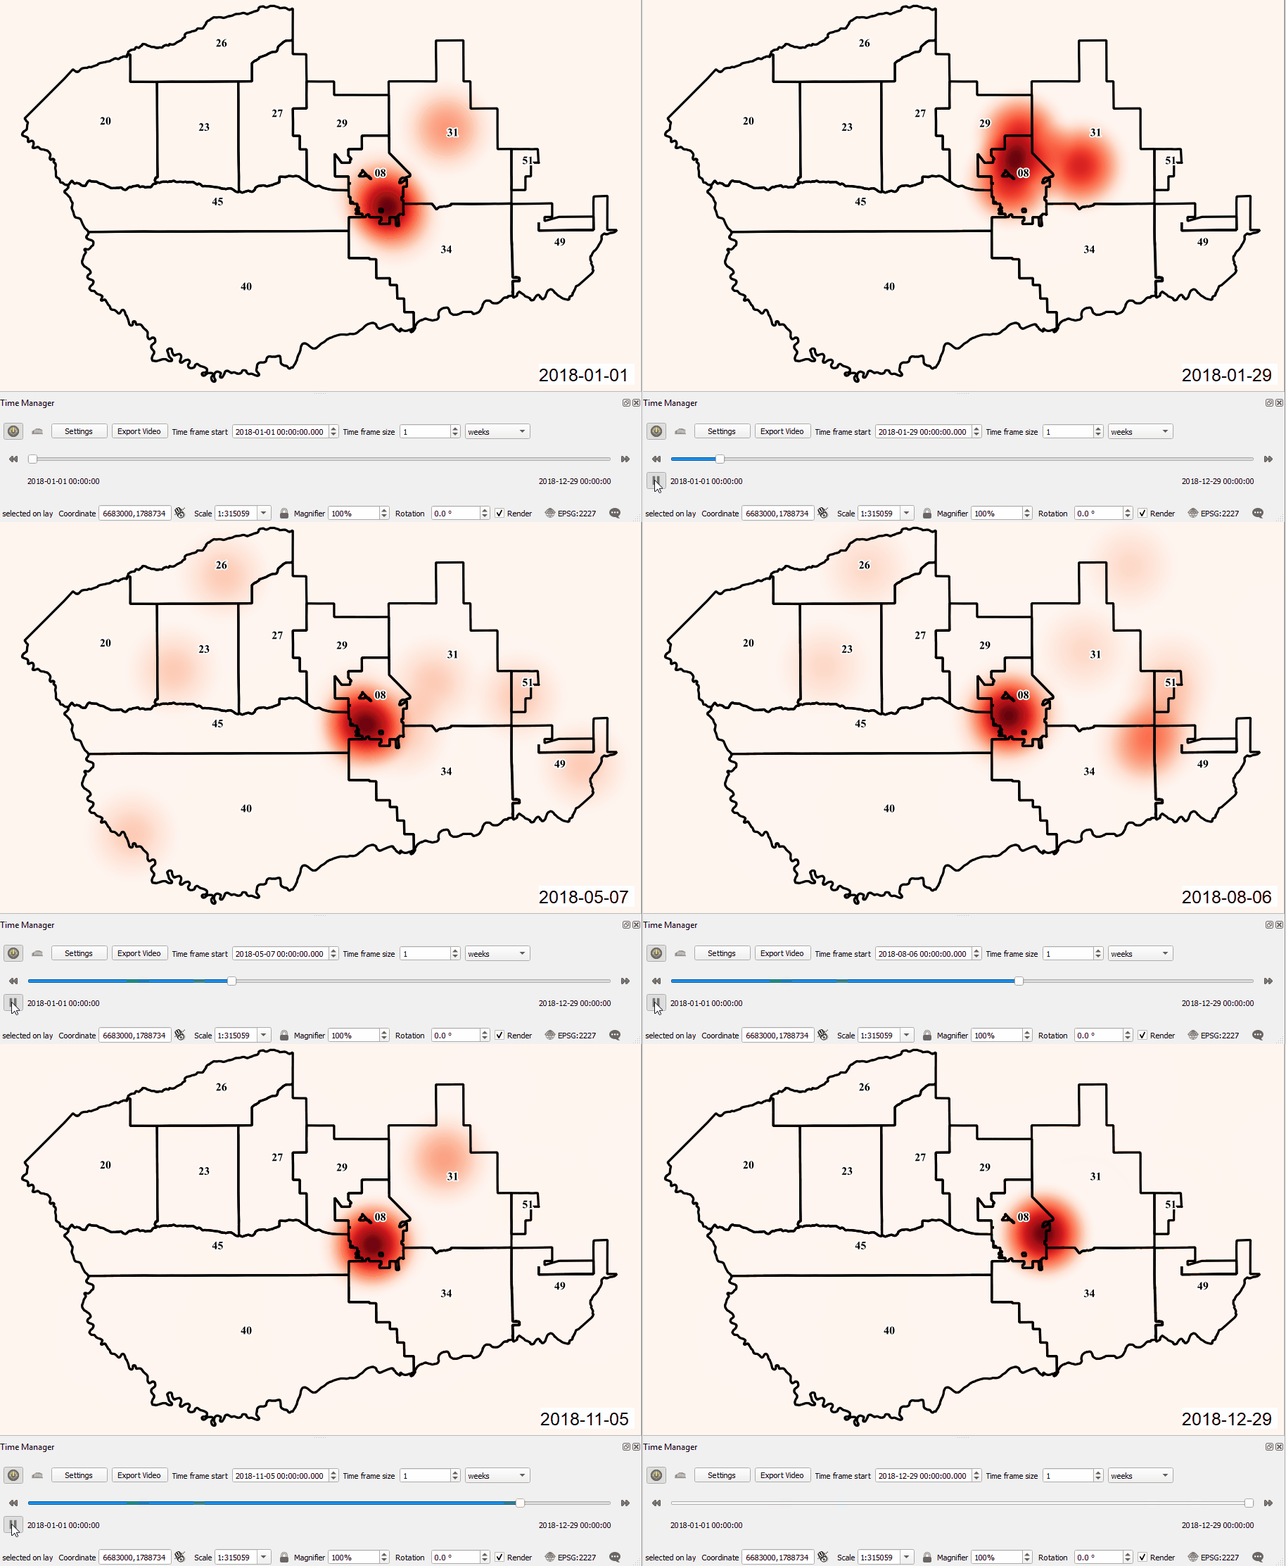
 and F) learned to animate temporal data using the QGIS Time Manager plugin. Here the mosquito population (heatmap) is being animated weekly for the year 2018 with mosquito management zones be displayed.
 All participants received official QGIS certificates for their participation.These workshop materials will part of the suite of https://communityhealthmaps.nlm.nih.gov/resources/ available through the Community Health Maps program in the near future.If you are interested in having this taught for you or your colleagues contact Kurt Menke (kurt@birdseyeviewgis.com)

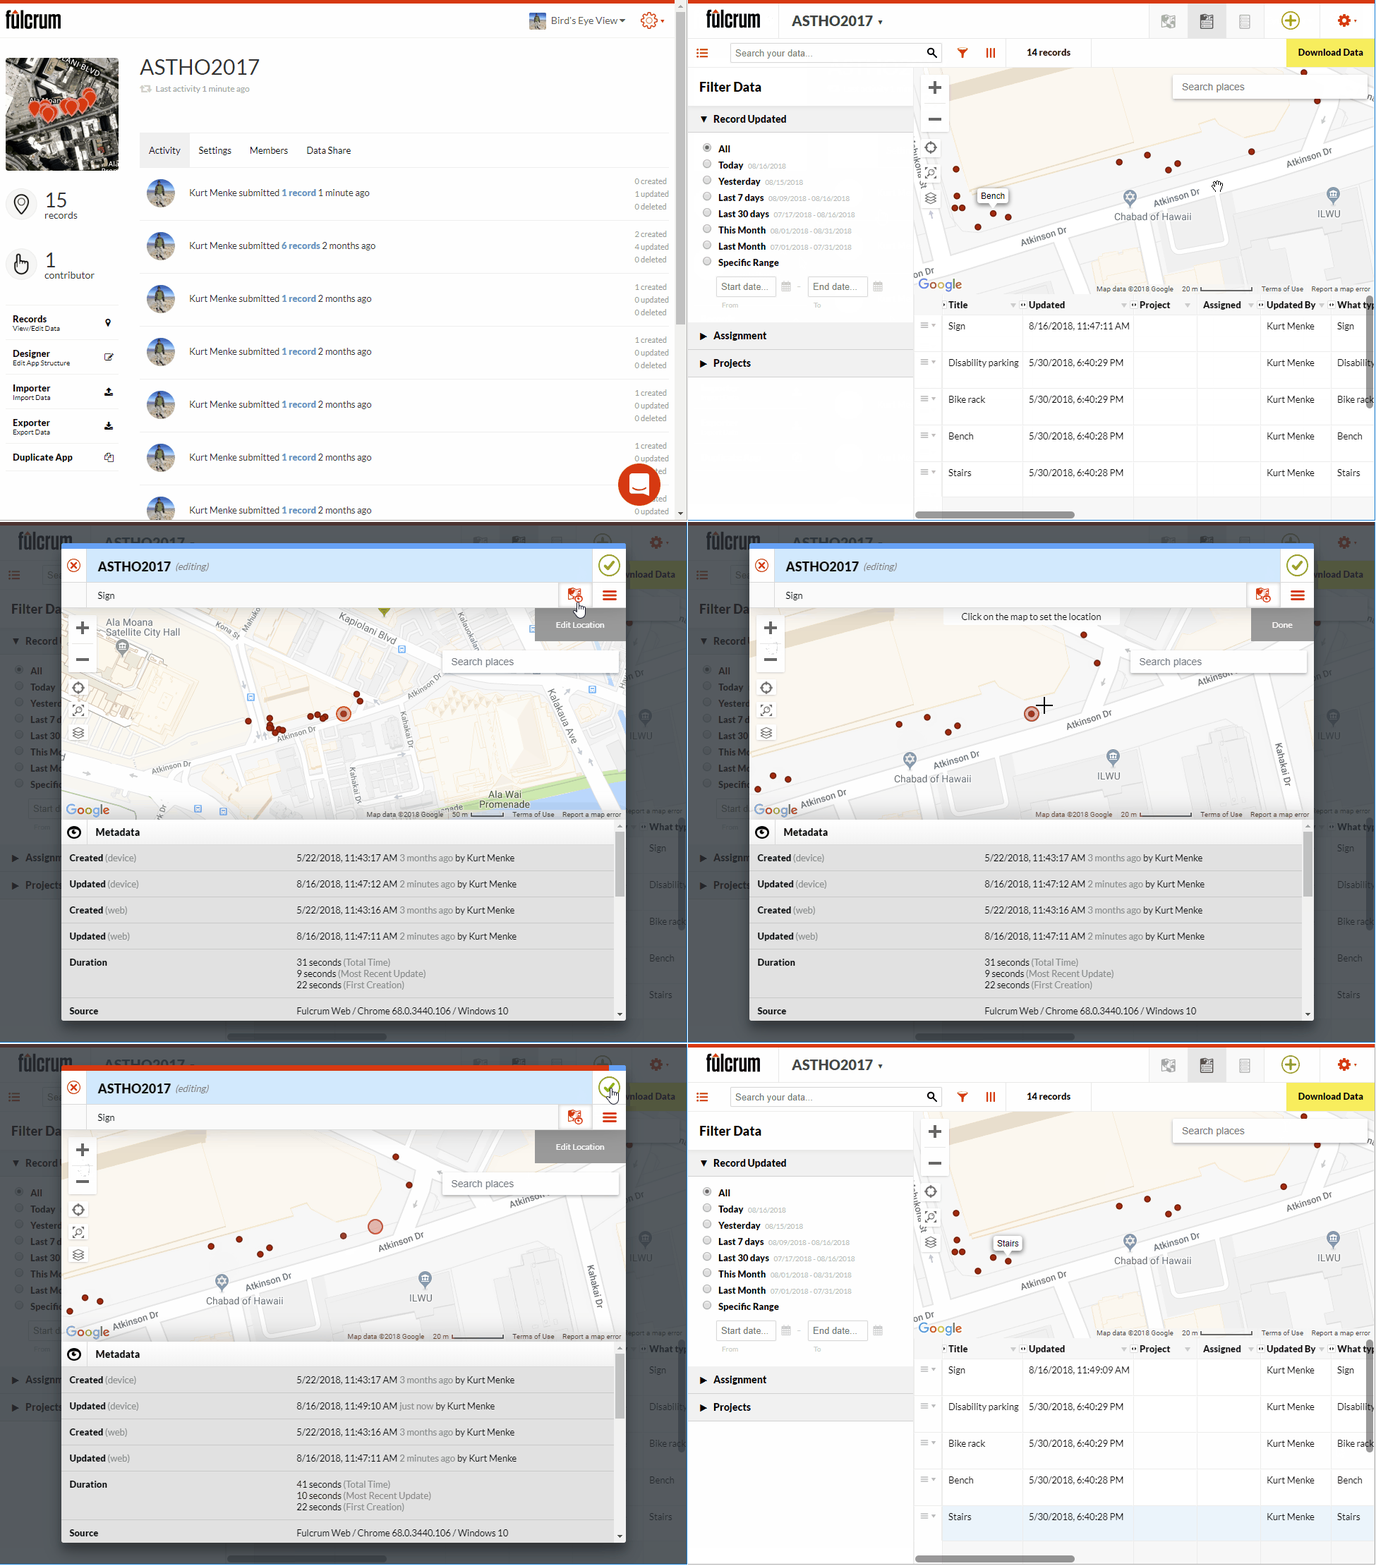
 . To change the location I click the Edit Location button. Then I click on the map at the location where the point should be moved. To save my edits I click the green Accept edits button
  .
. I can also edit the attributes of a point. It is a similar process. First I click on the point I need to edit. Then I click the pencil icon. I scroll down to find the attribute I need to edit and make the change. Once done click the green check mark button to accept the changes.
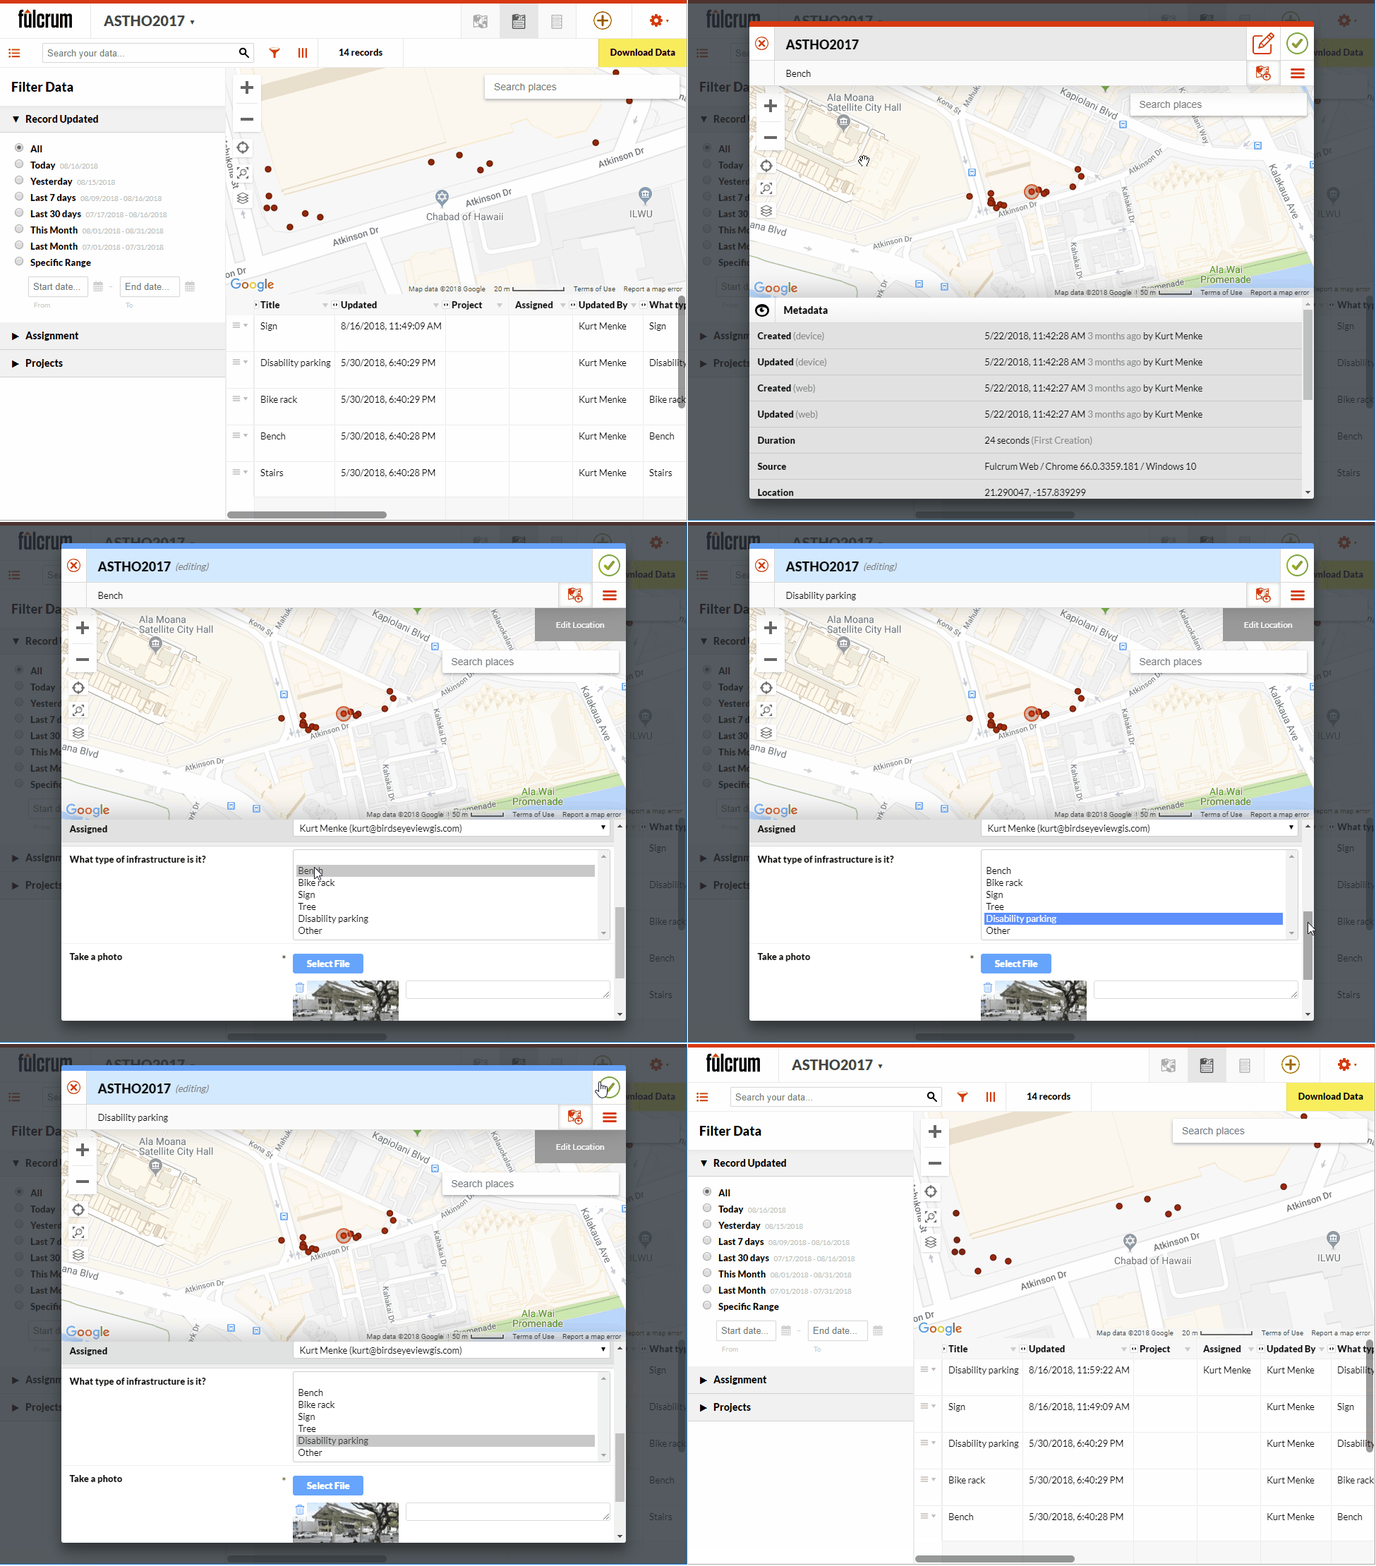 I can also add new points from this interface in Fulcrum. To do this I simply click the green Add point button
  and populate the attributes. If I have elements where were set to required in my App, I will have to populate them here, just as I did with my mobile device in the field.So if you have collected some data and realize it needs some correction you can do that directly in Fulcrum prior to downloading it. Also note that the data can also be edited in
  The first afternoon was focused on the impacts of climate change, preparedness and building resilience. There were great presentations on climate change (Capt. Barry Choy - NOAA), an overview of the tools and programs available from the CDC (Paul Schramm), and issues with vector-borne diseases and mosquitoes (Janet McAllister). The ASTHO grantees then gave some some sobering presentations on current issues people are dealing with in the Mariana Islands, Micronesia and the U.S. Virgin Islands.
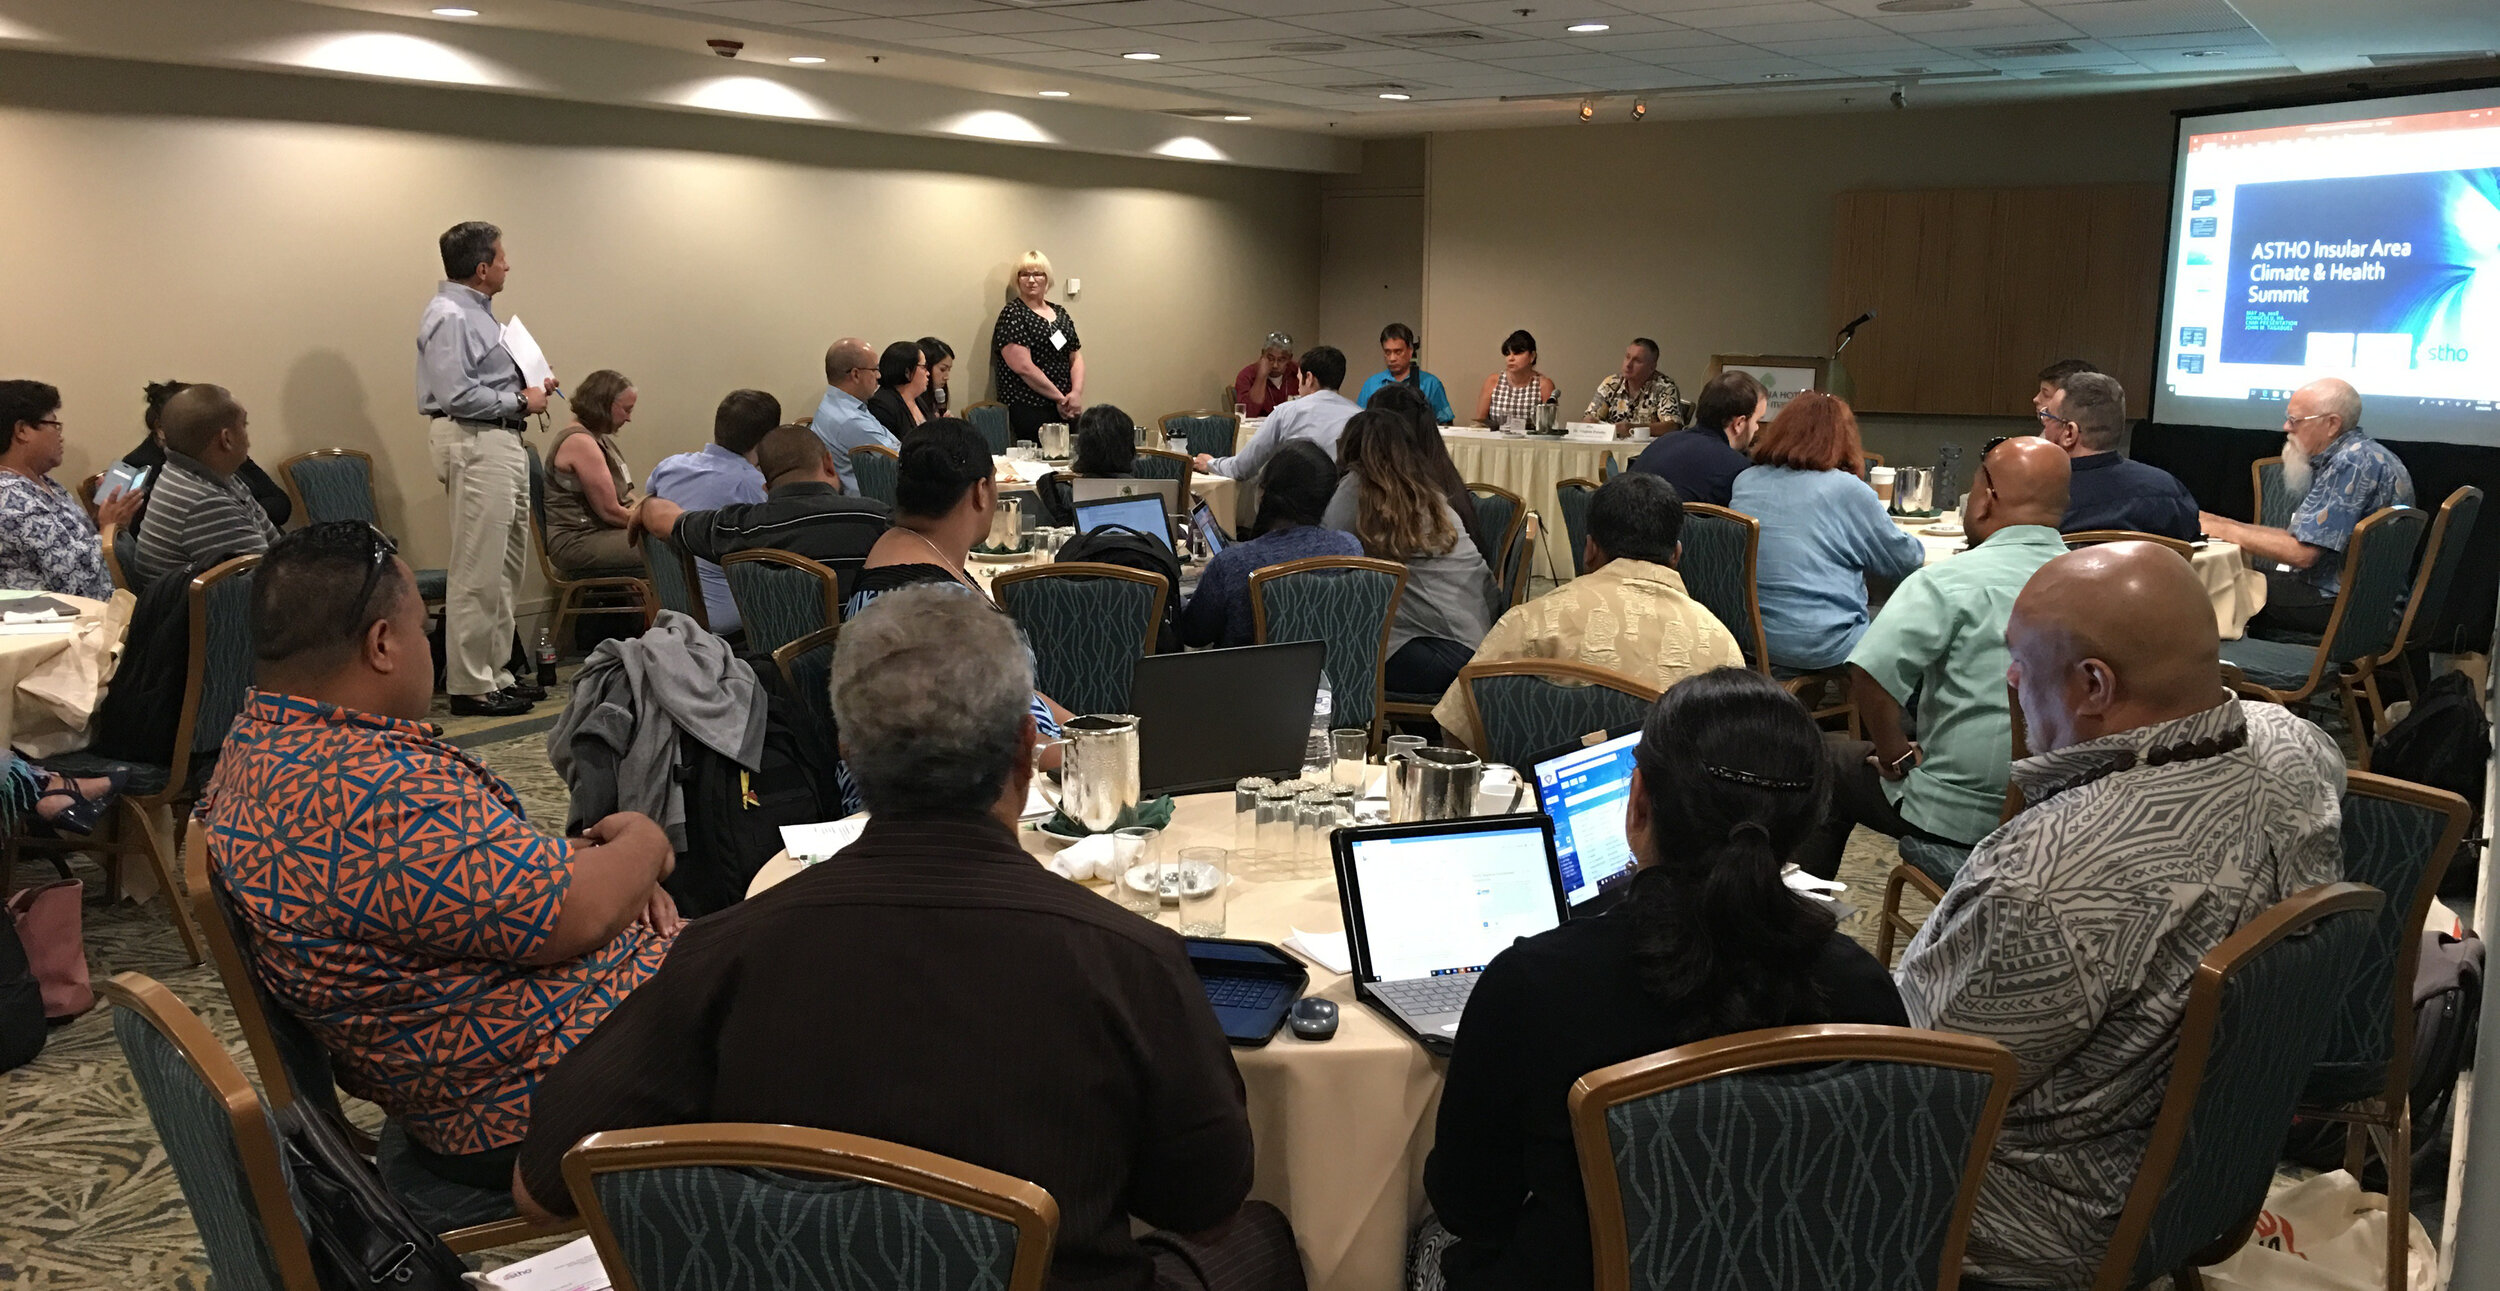 The second day focused more on tools and resources. There were more detailed talks given by the CDC on Technical Assistance for Vector Control and Tools and Resources for Climate and Water Safety. That afternoon we taught a 3.5 hour Community Health Maps Train-the-Trainers workshop to a group of health officials from each territory. We went through the entire CHM workflow: A) how to design a data collection form, B) how to collect data, C) how to make a map in Carto and D) how to bring the data into QGIS.
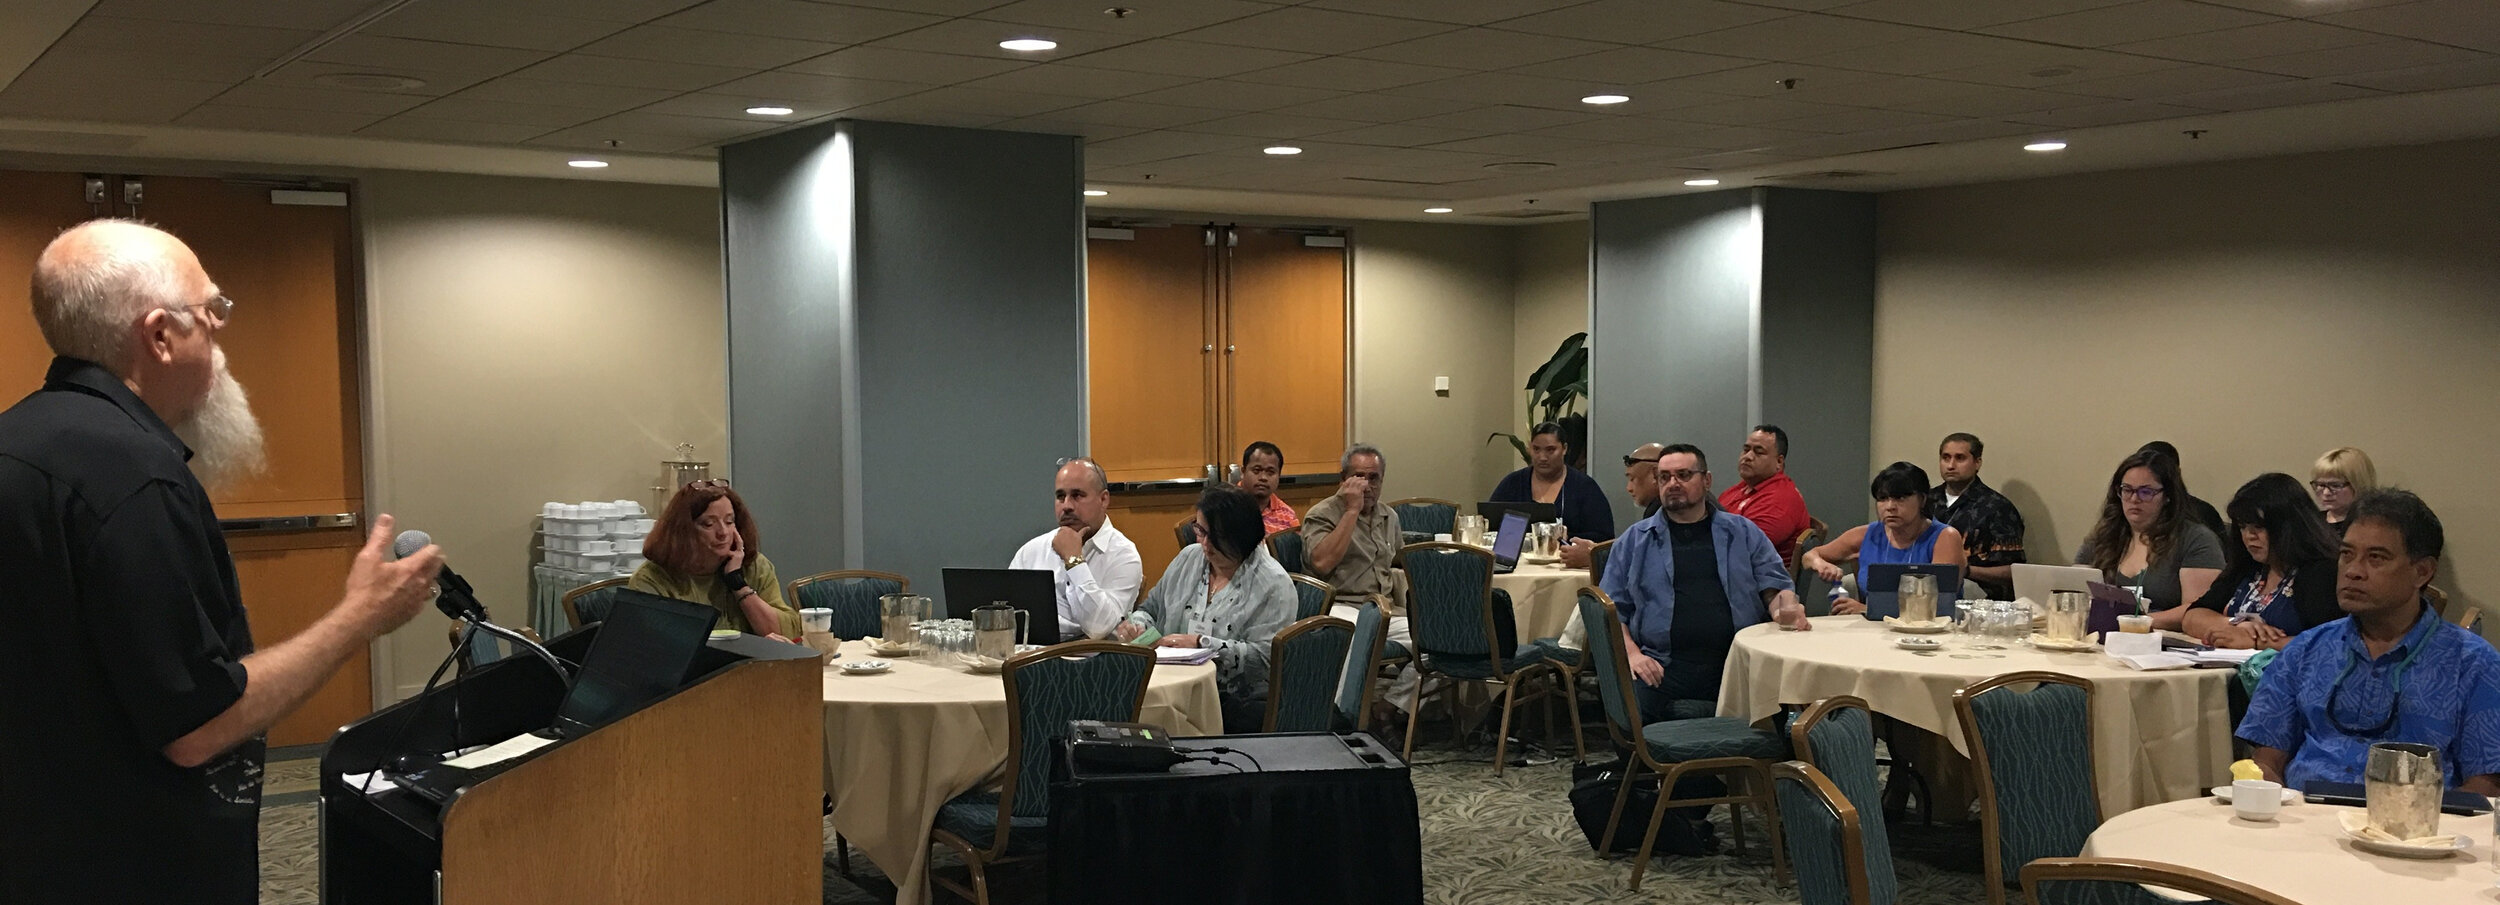 Most of the trainees had little to no GIS training yet instantly knew how mapping could apply to their work and lives. They want to map everything related to hurricane relief, salt water resistant taro farms, infrastructure related to mosquito outbreaks etc. A benefit of having the community do this is that they can be in charge of their own data and it helps build community relationships.Over the three days I heard a lot of side discussions about the usefulness of the free/low cost/open source CHM approach. The cost of proprietary solutions is often a significant barrier to entry into the world of community data collection and mapping. We were gratified to hear some very positive feedback on the workshops and CHM overall during the closing session. There seems to be a lot of potential in CHM helping both U.S. Territories and ASTHO deal with the immediate and long-term health issues related to climate.