MapBox is a very popular web mapping platform used by many social networking apps and news outlets. It includes a very powerful set of tools and comes with a modest pricing scheme. The amount you pay depends on the web traffic your site receives, for many this will be next to free. As such this can be a great alternative way to publish interactive maps.
Uploading Data
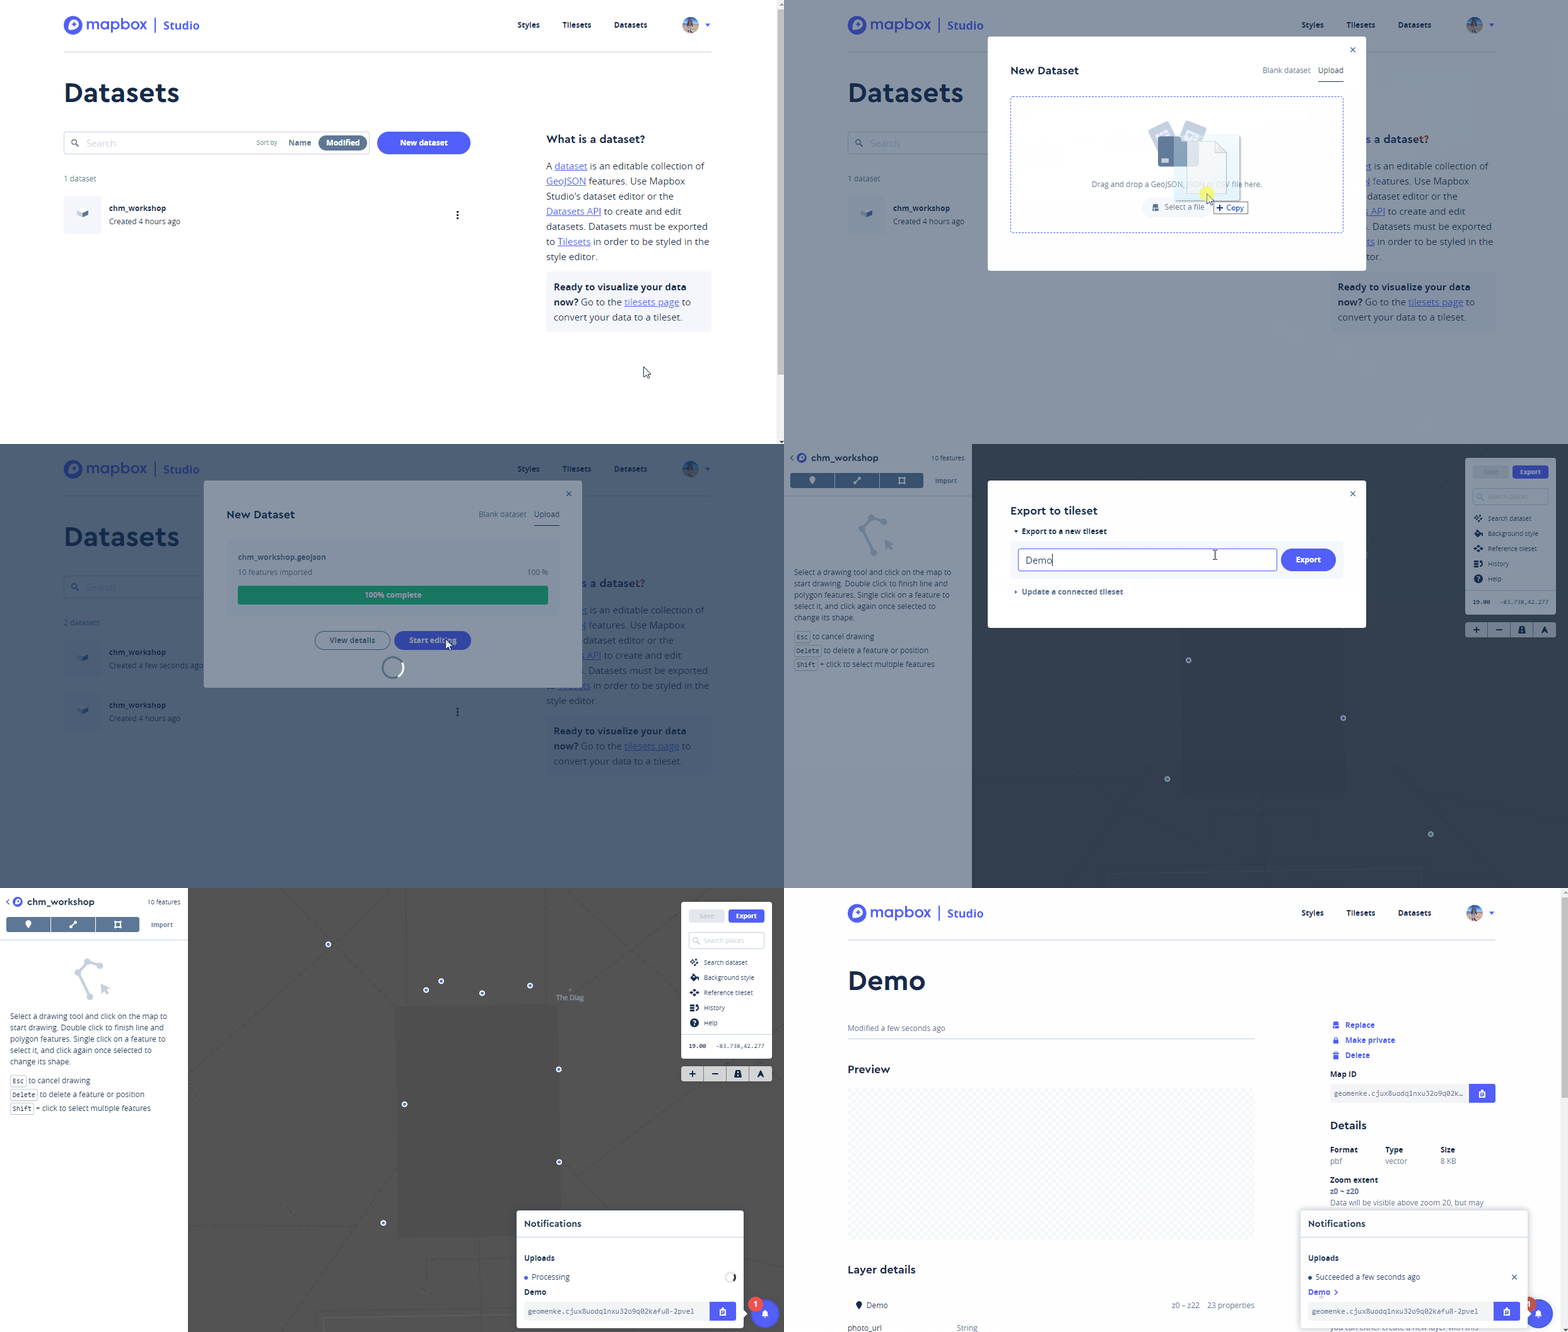
If you have collected data using Fulcrum you will want to export that as a GeoJSON file.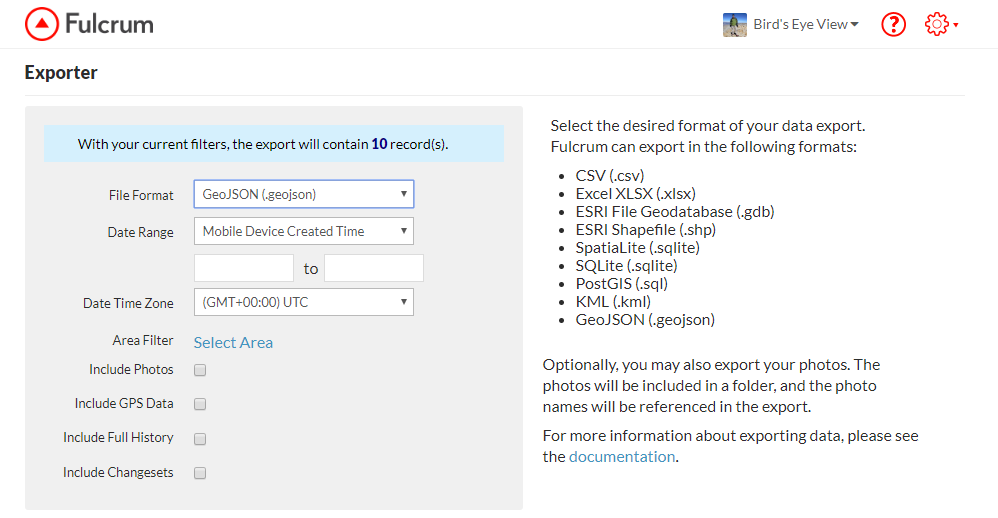 To start you can create a free account at https://www.mapbox.com/. Once logged in click on the Products menu, choose Studio. From there click the Get started link. From your Studio dashboard click on Datasets.
- Click the New Dataset button
- Select Upload
- Drag your GeoJSON file onto the form and click Confirm and Create
- After it has finished uploading click Start editing. The data editor will open and your points will be displayed on a dark basemap. Next you will export your data to something called a tileset. Web maps are composed of tiles for each zoom level. During this next step MapBox will generate all the map tiles for your dataset.
- Click the Export button and select Export to a new tileset.
- Name your tileset and click Export.
- It will process your data. When it has finished click on the dataset name to return to your Datasets on your Studio dashboard.
Creating a Style
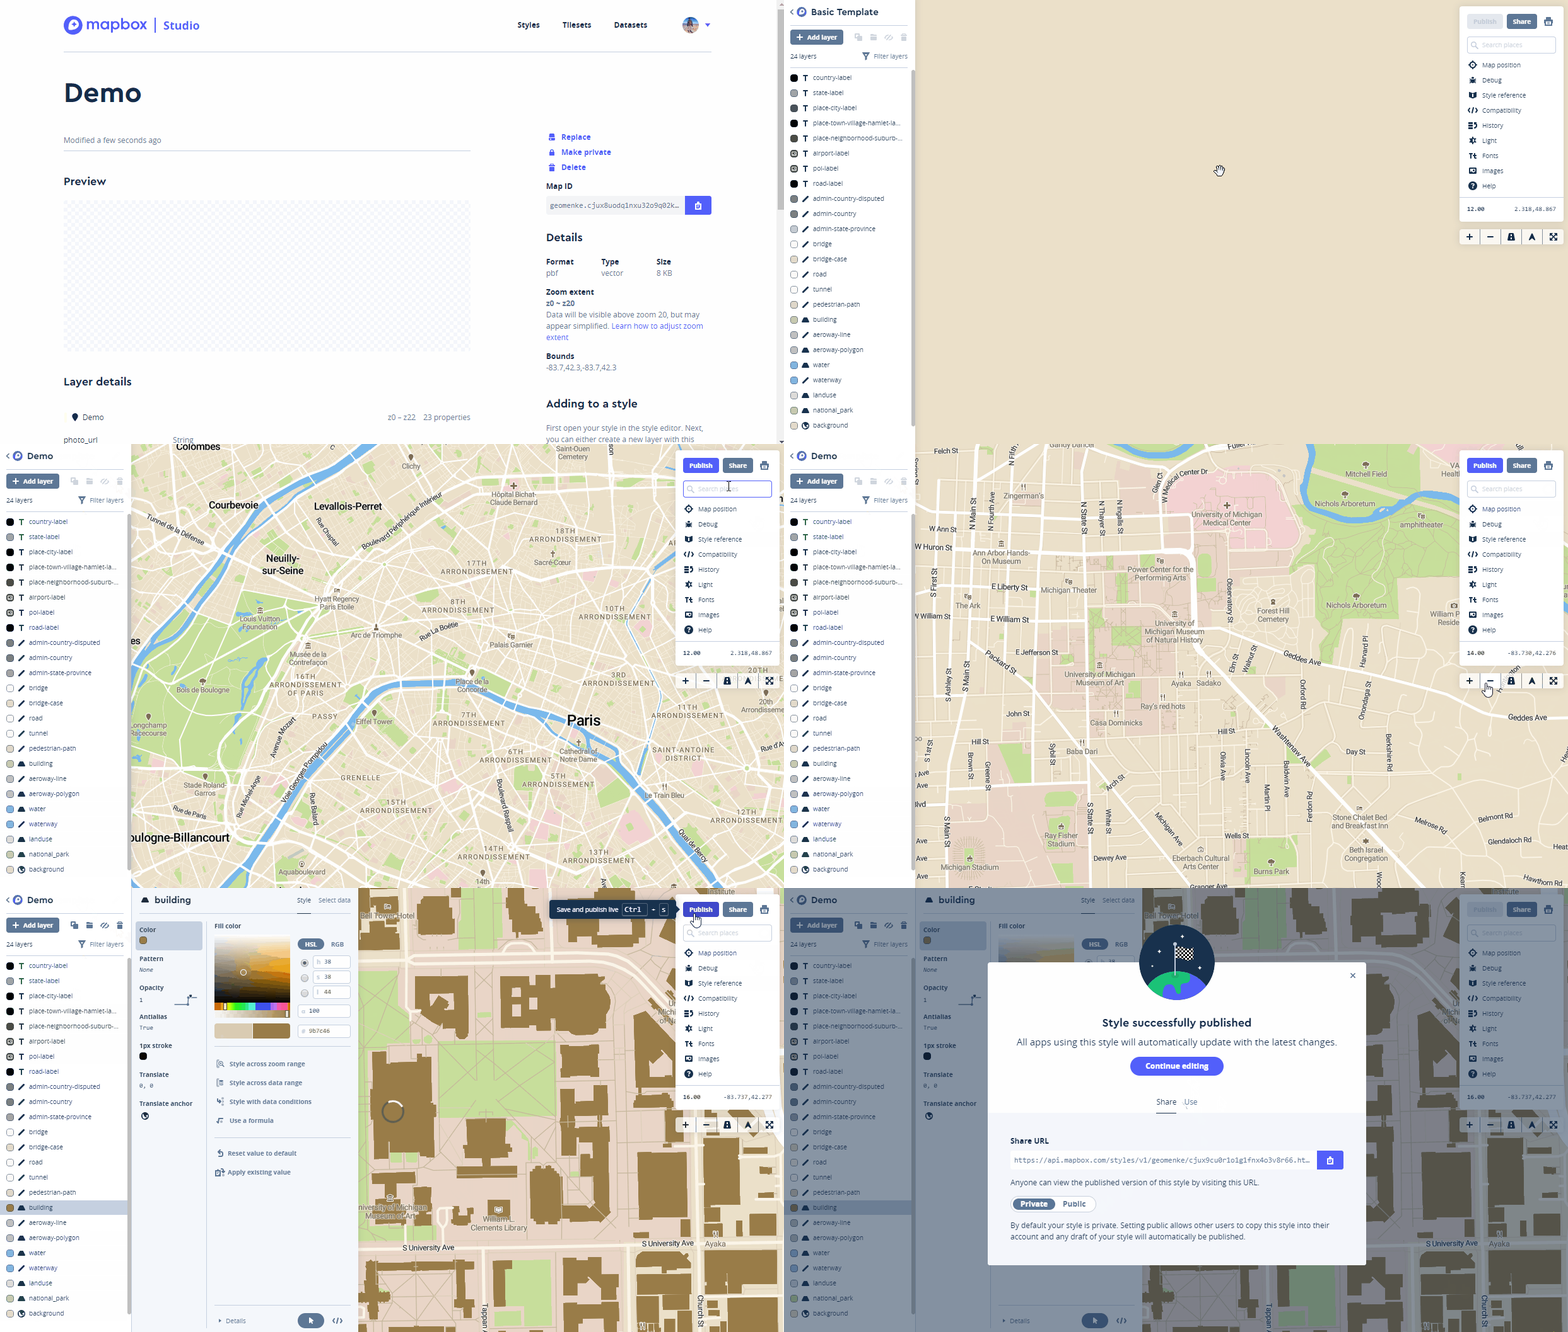
Now that you have uploaded your data you will learn about map Styles. Click on the Styles link on the top row of your dashboard.
- Click the New style button
- Choose an existing style such as Basic Template and click the Create button.
- The style template will open. You can rename it from Basic Template to something more meaningful. Here the style has been renamed to Demo.
- Next search for your area of interest in the white box to the right. In the example below I have searched for Ann Arbor, Michigan and then zoomed in a little closer to the data collection area.
- You can customize the styling for any and all of the layers that make up this template. Here I am darkening the brown used for buildings a bit. To do this I clicked on Buildings and changed the color with the color widget.
- Once you have made the changes you desire click the Publish button. Click Publish again and you have created your own basemap style.
Adding a Layer to Your Map
Now you can add your tileset to your map style. Click the Add Layer button and choose the tileset you created. 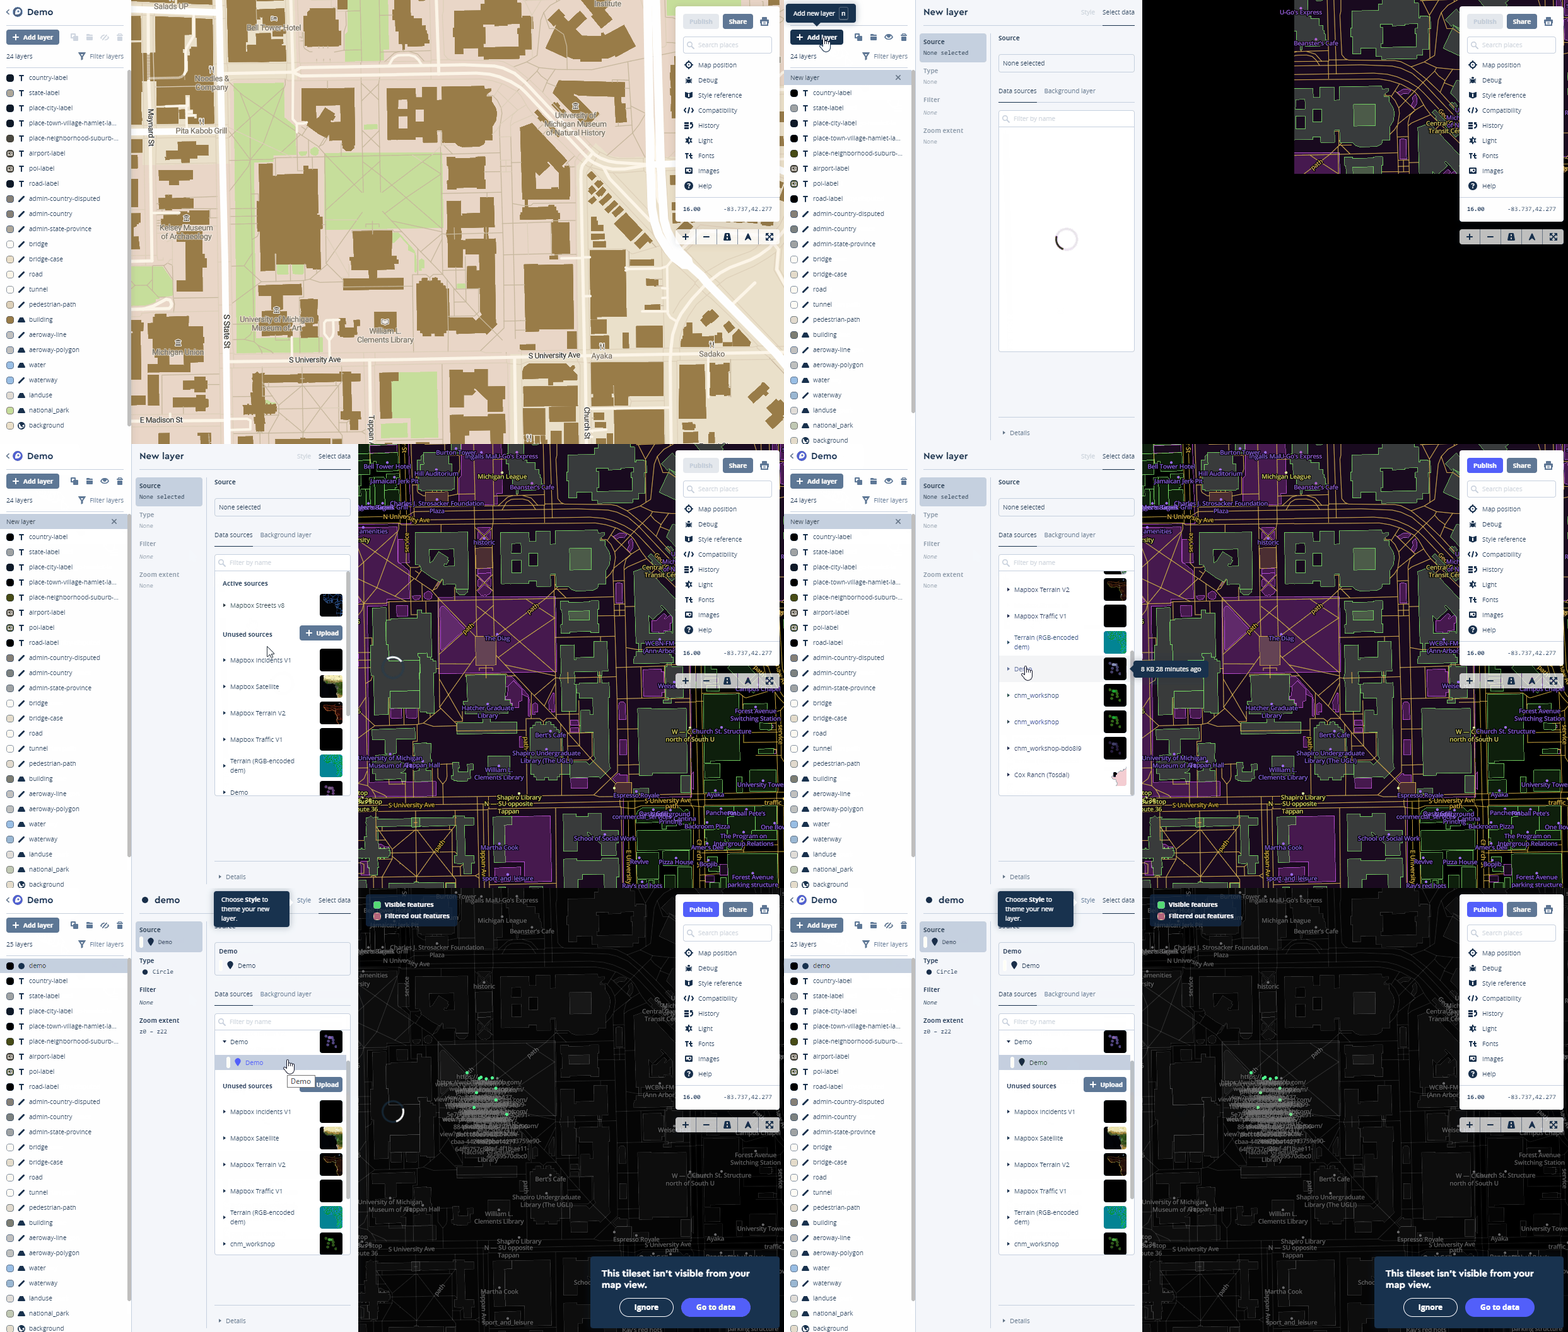
Styling Points
Once the layer has been added click on the Style tab of the layer. Next you will learn to give each type of Infrastructure it's own point color.
- Select the Color component
- Click on Style with data conditions
- The popup box for Choose a data field window opens. In this case the field is named Infrastructure so I begin typing Inf to more quickly locate the field. When you have found the field containing the categories for mapping, select it.
- A Set values for box window opens. Select the first value e.g., Bench. The Data field will now read: Data field Infrastructure is Bench. Select the color for that item.
- In the Set values for box window select the next item e.g., Sign and assign a color.
- Continue until you have assigned colors to each value.
 Creating pop up windows takes a little more work. You can read the MapBox tutorial for that here.
Publishing a Map
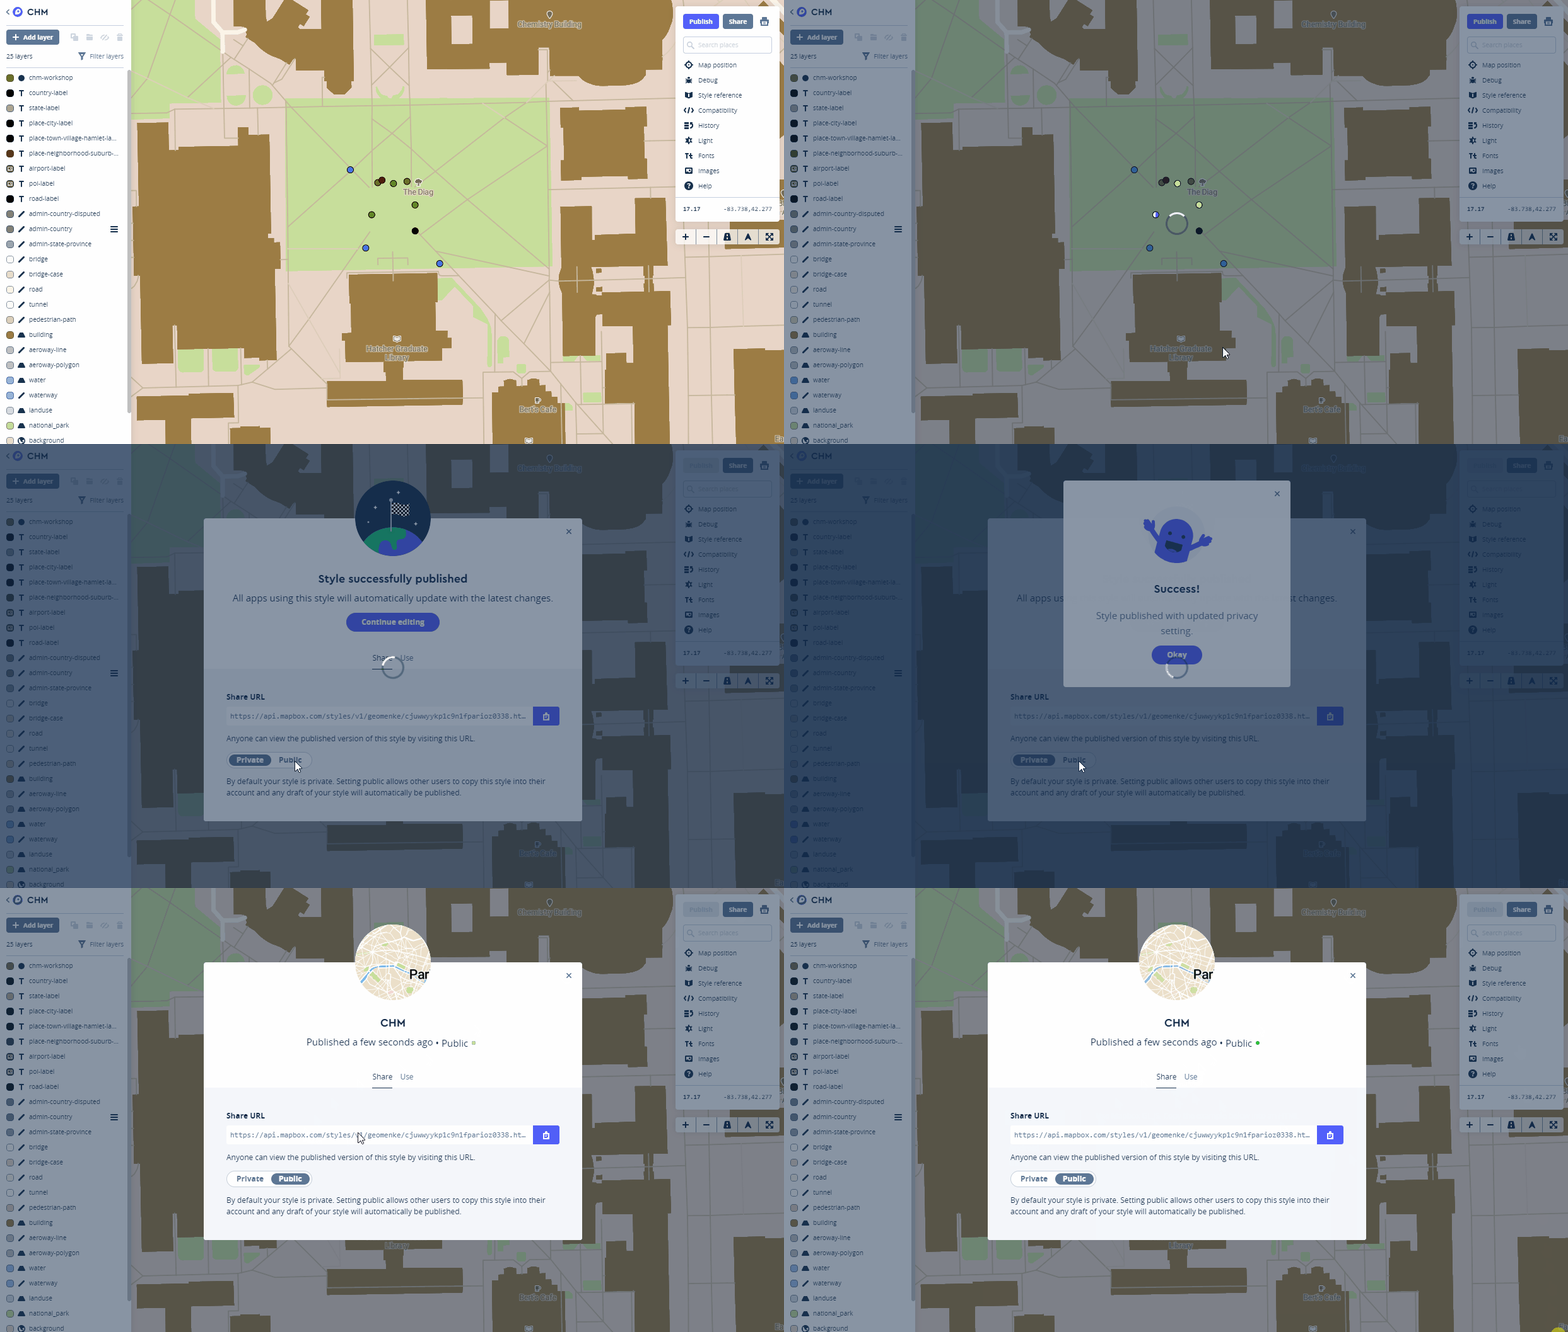
- When you are ready to share your map click the Publish button.
- In the window that opens click Publish again and you Style will be published again and a url to your map will be provided.
- You can also change the permissions here, and if you do you will receive a Success message.
- When finished close the window.
- Then click the Share button. You are given a url on the Share tab and a code snippet on the Use tab. The code snippet can be copied and pasted into a website to embed your map.
 This is just a basic primer for getting started with MapBox Studio. There is a lot you can do with this platform. You can find more tutorials here.

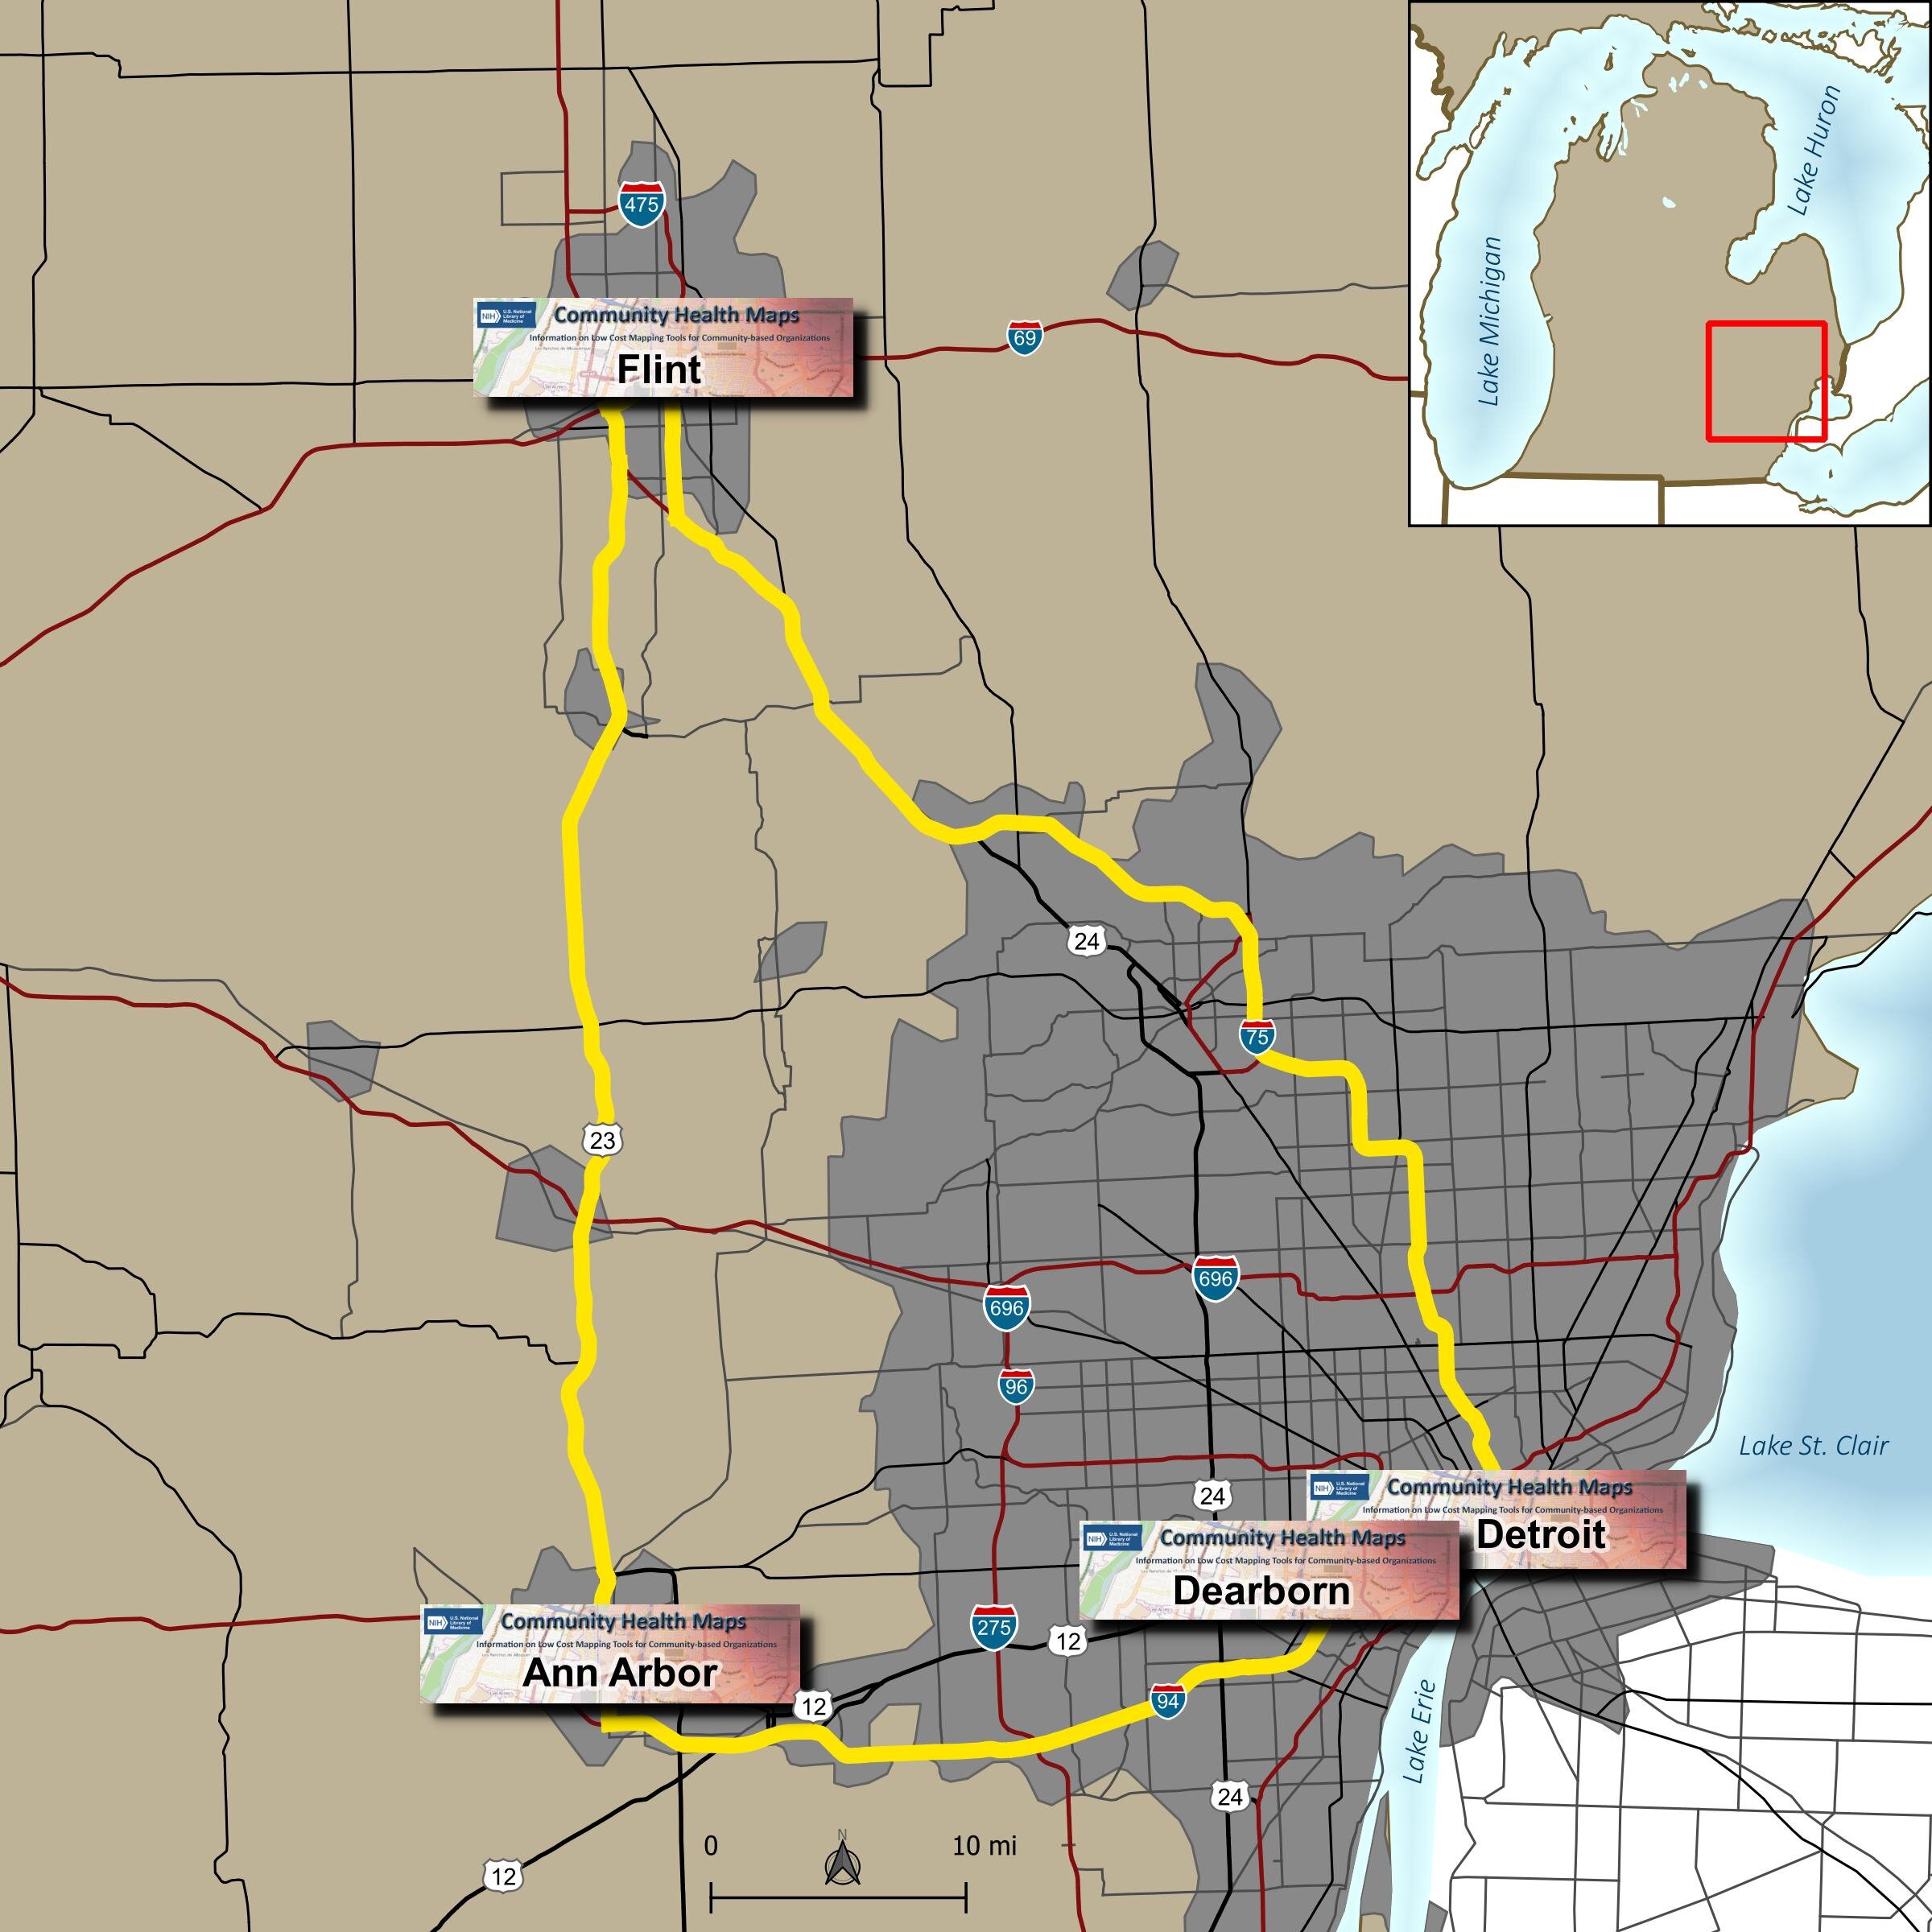 Due to great outreach by the University of Michigan team of - Tyler Nix, Marisa Conte, Alexa Rivera, Justin Schell, Sara McDonnell, Troy Rosencrants, Kui-Bin Im and Claudia Walters - the workshops had great attendance and ran like clockwork.The first was held at the University of Michigan - Ann Arbor at the Hatcher Graduate
 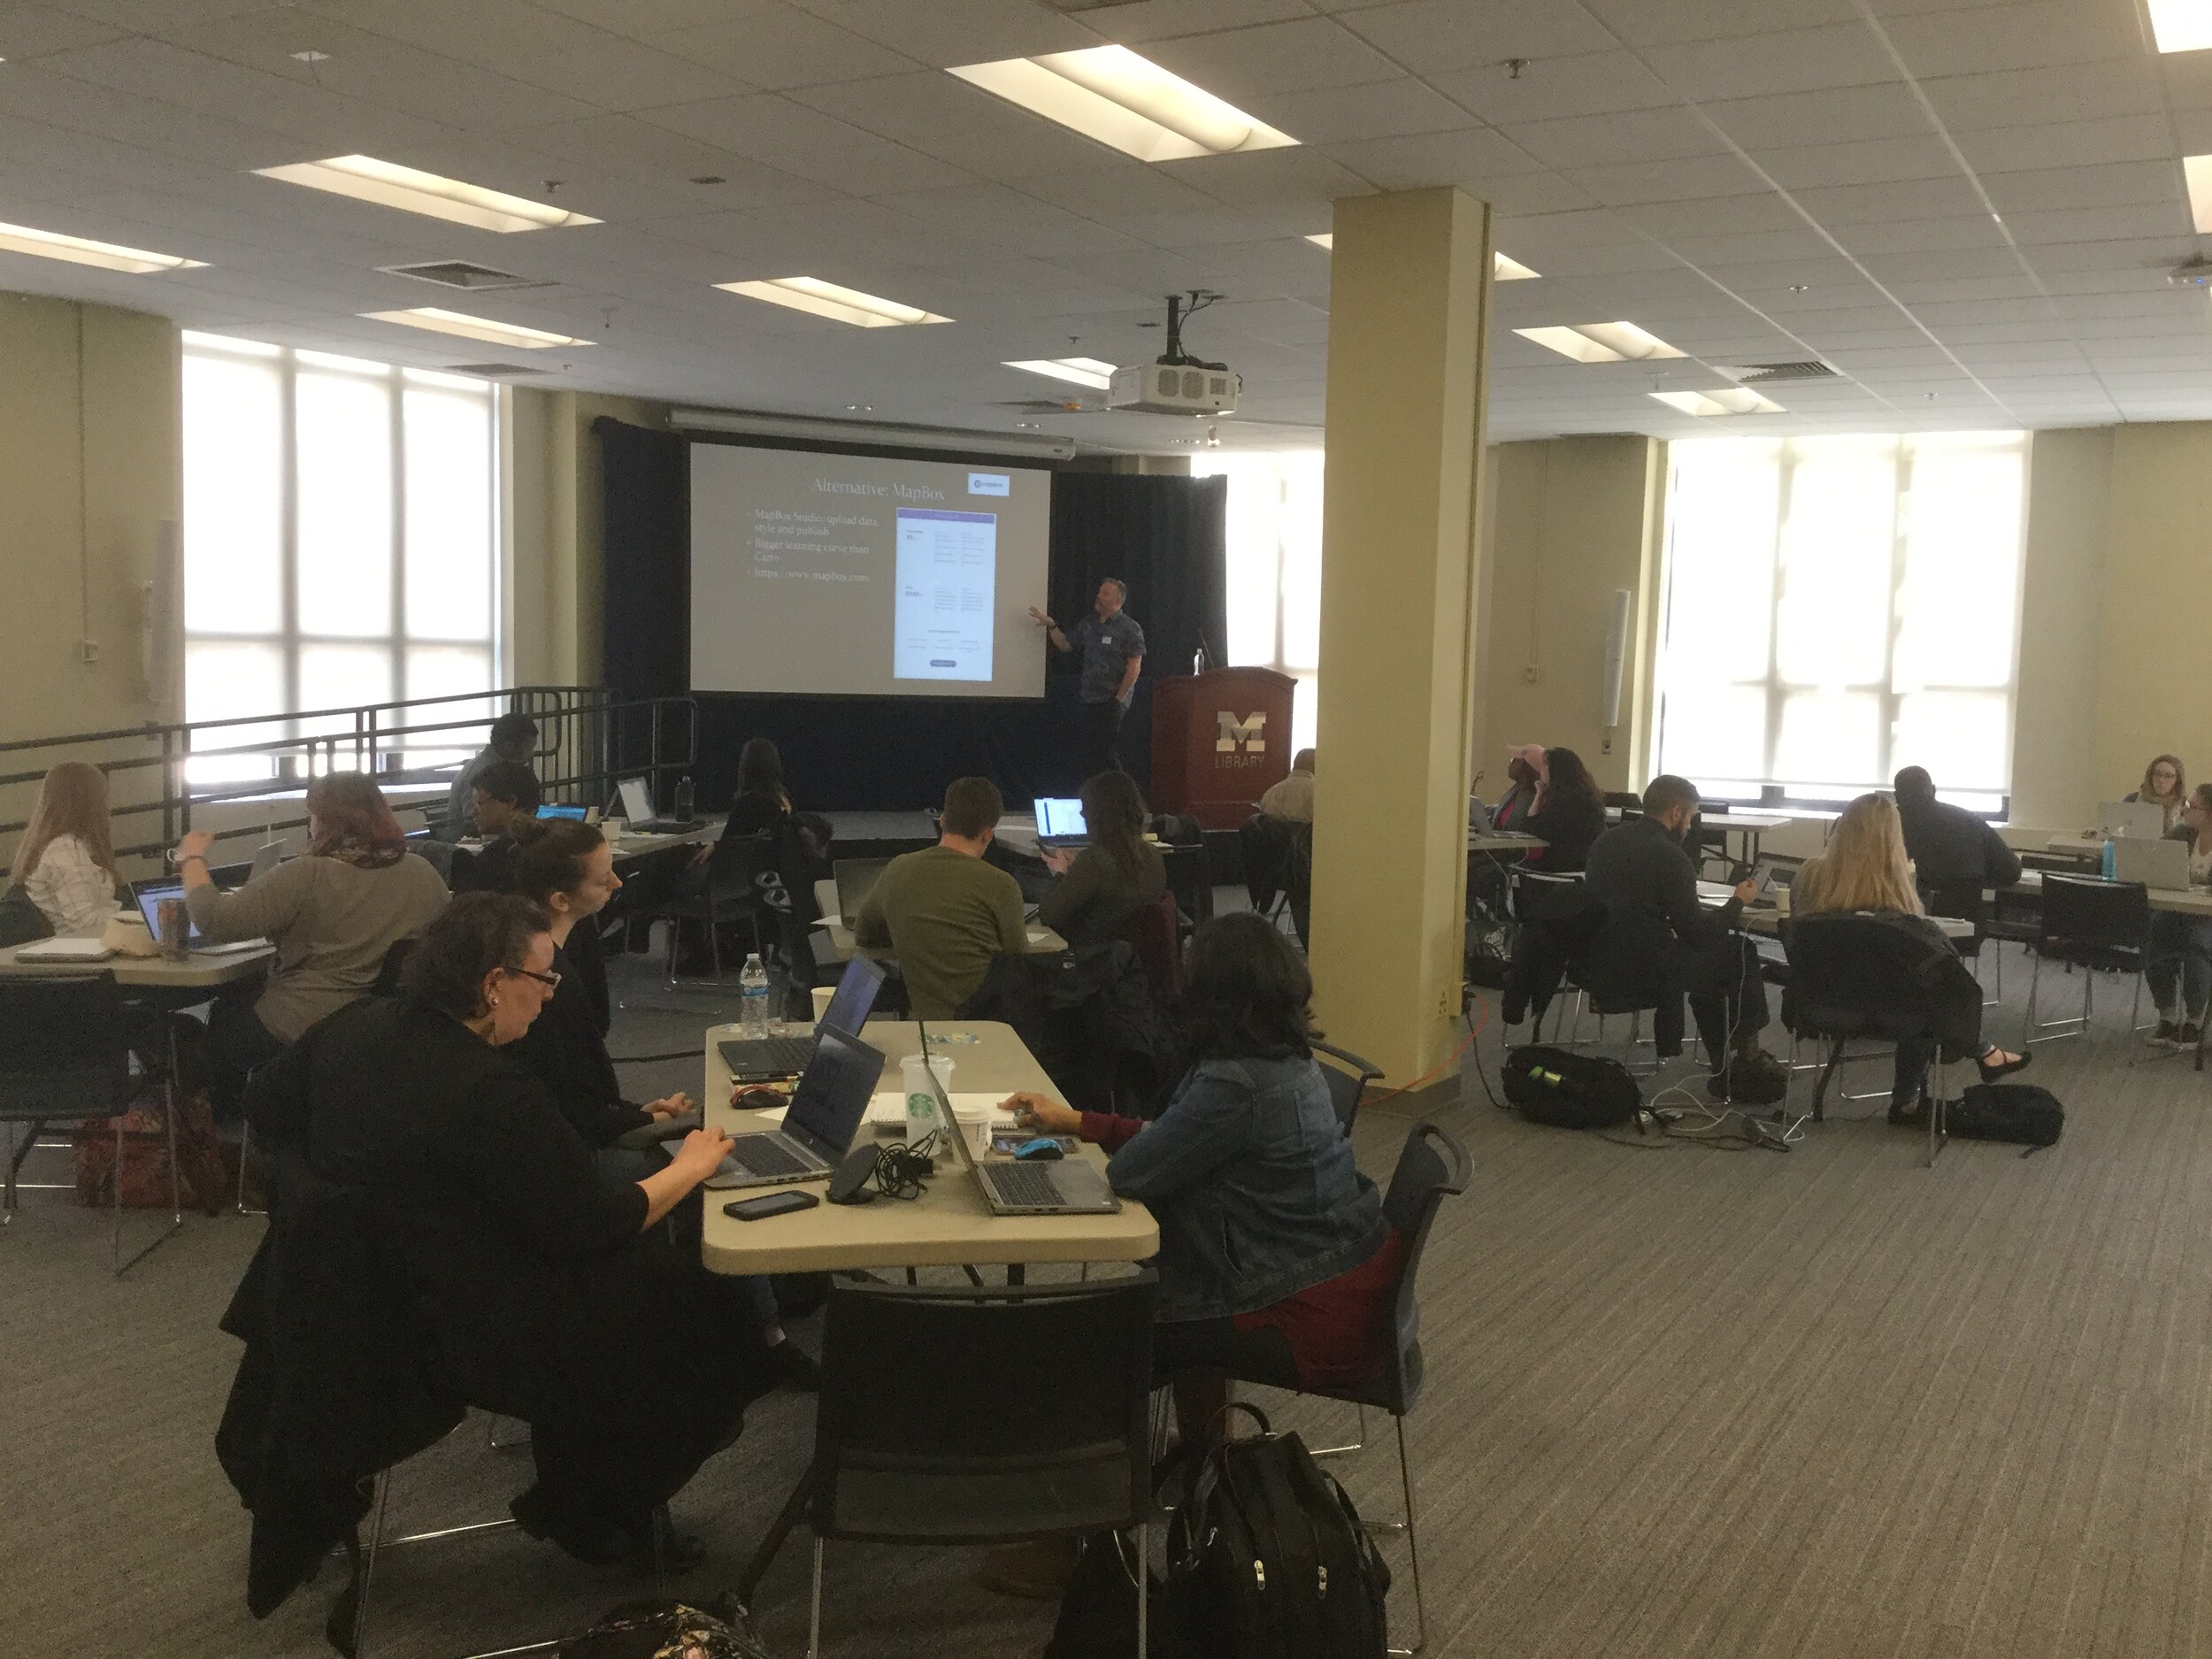 The second was held the following day at the UM Flint. We started in the University Center Happenings Room and moved to Thompson Library for the afternoon QGIS session. Forty five people came out for
 The third was held at the UM Detroit Center on April 4th. Thirty people registered for this workshop. This was probably the most diverse group including some UM faculty, plus Wayne State faculty, county public health staff (including some as far away as Saginaw County) and non-profit public health workers.
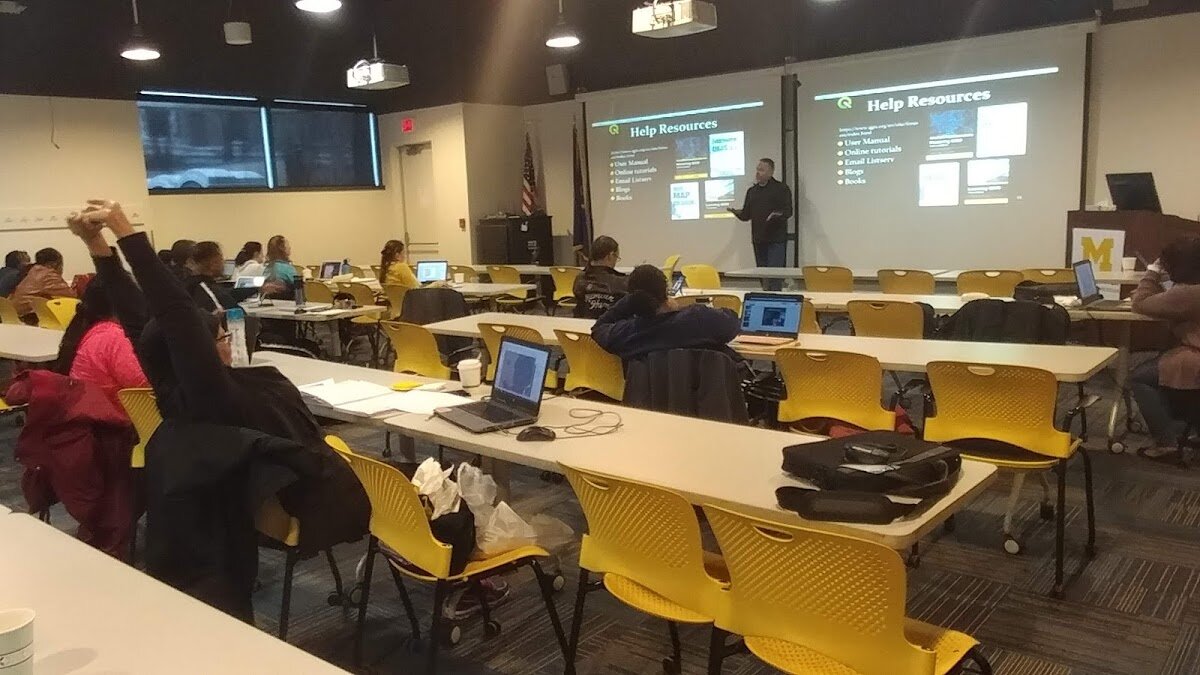 The fourth was held at UM Dearborn on April 5th. This was the smallest of the fo
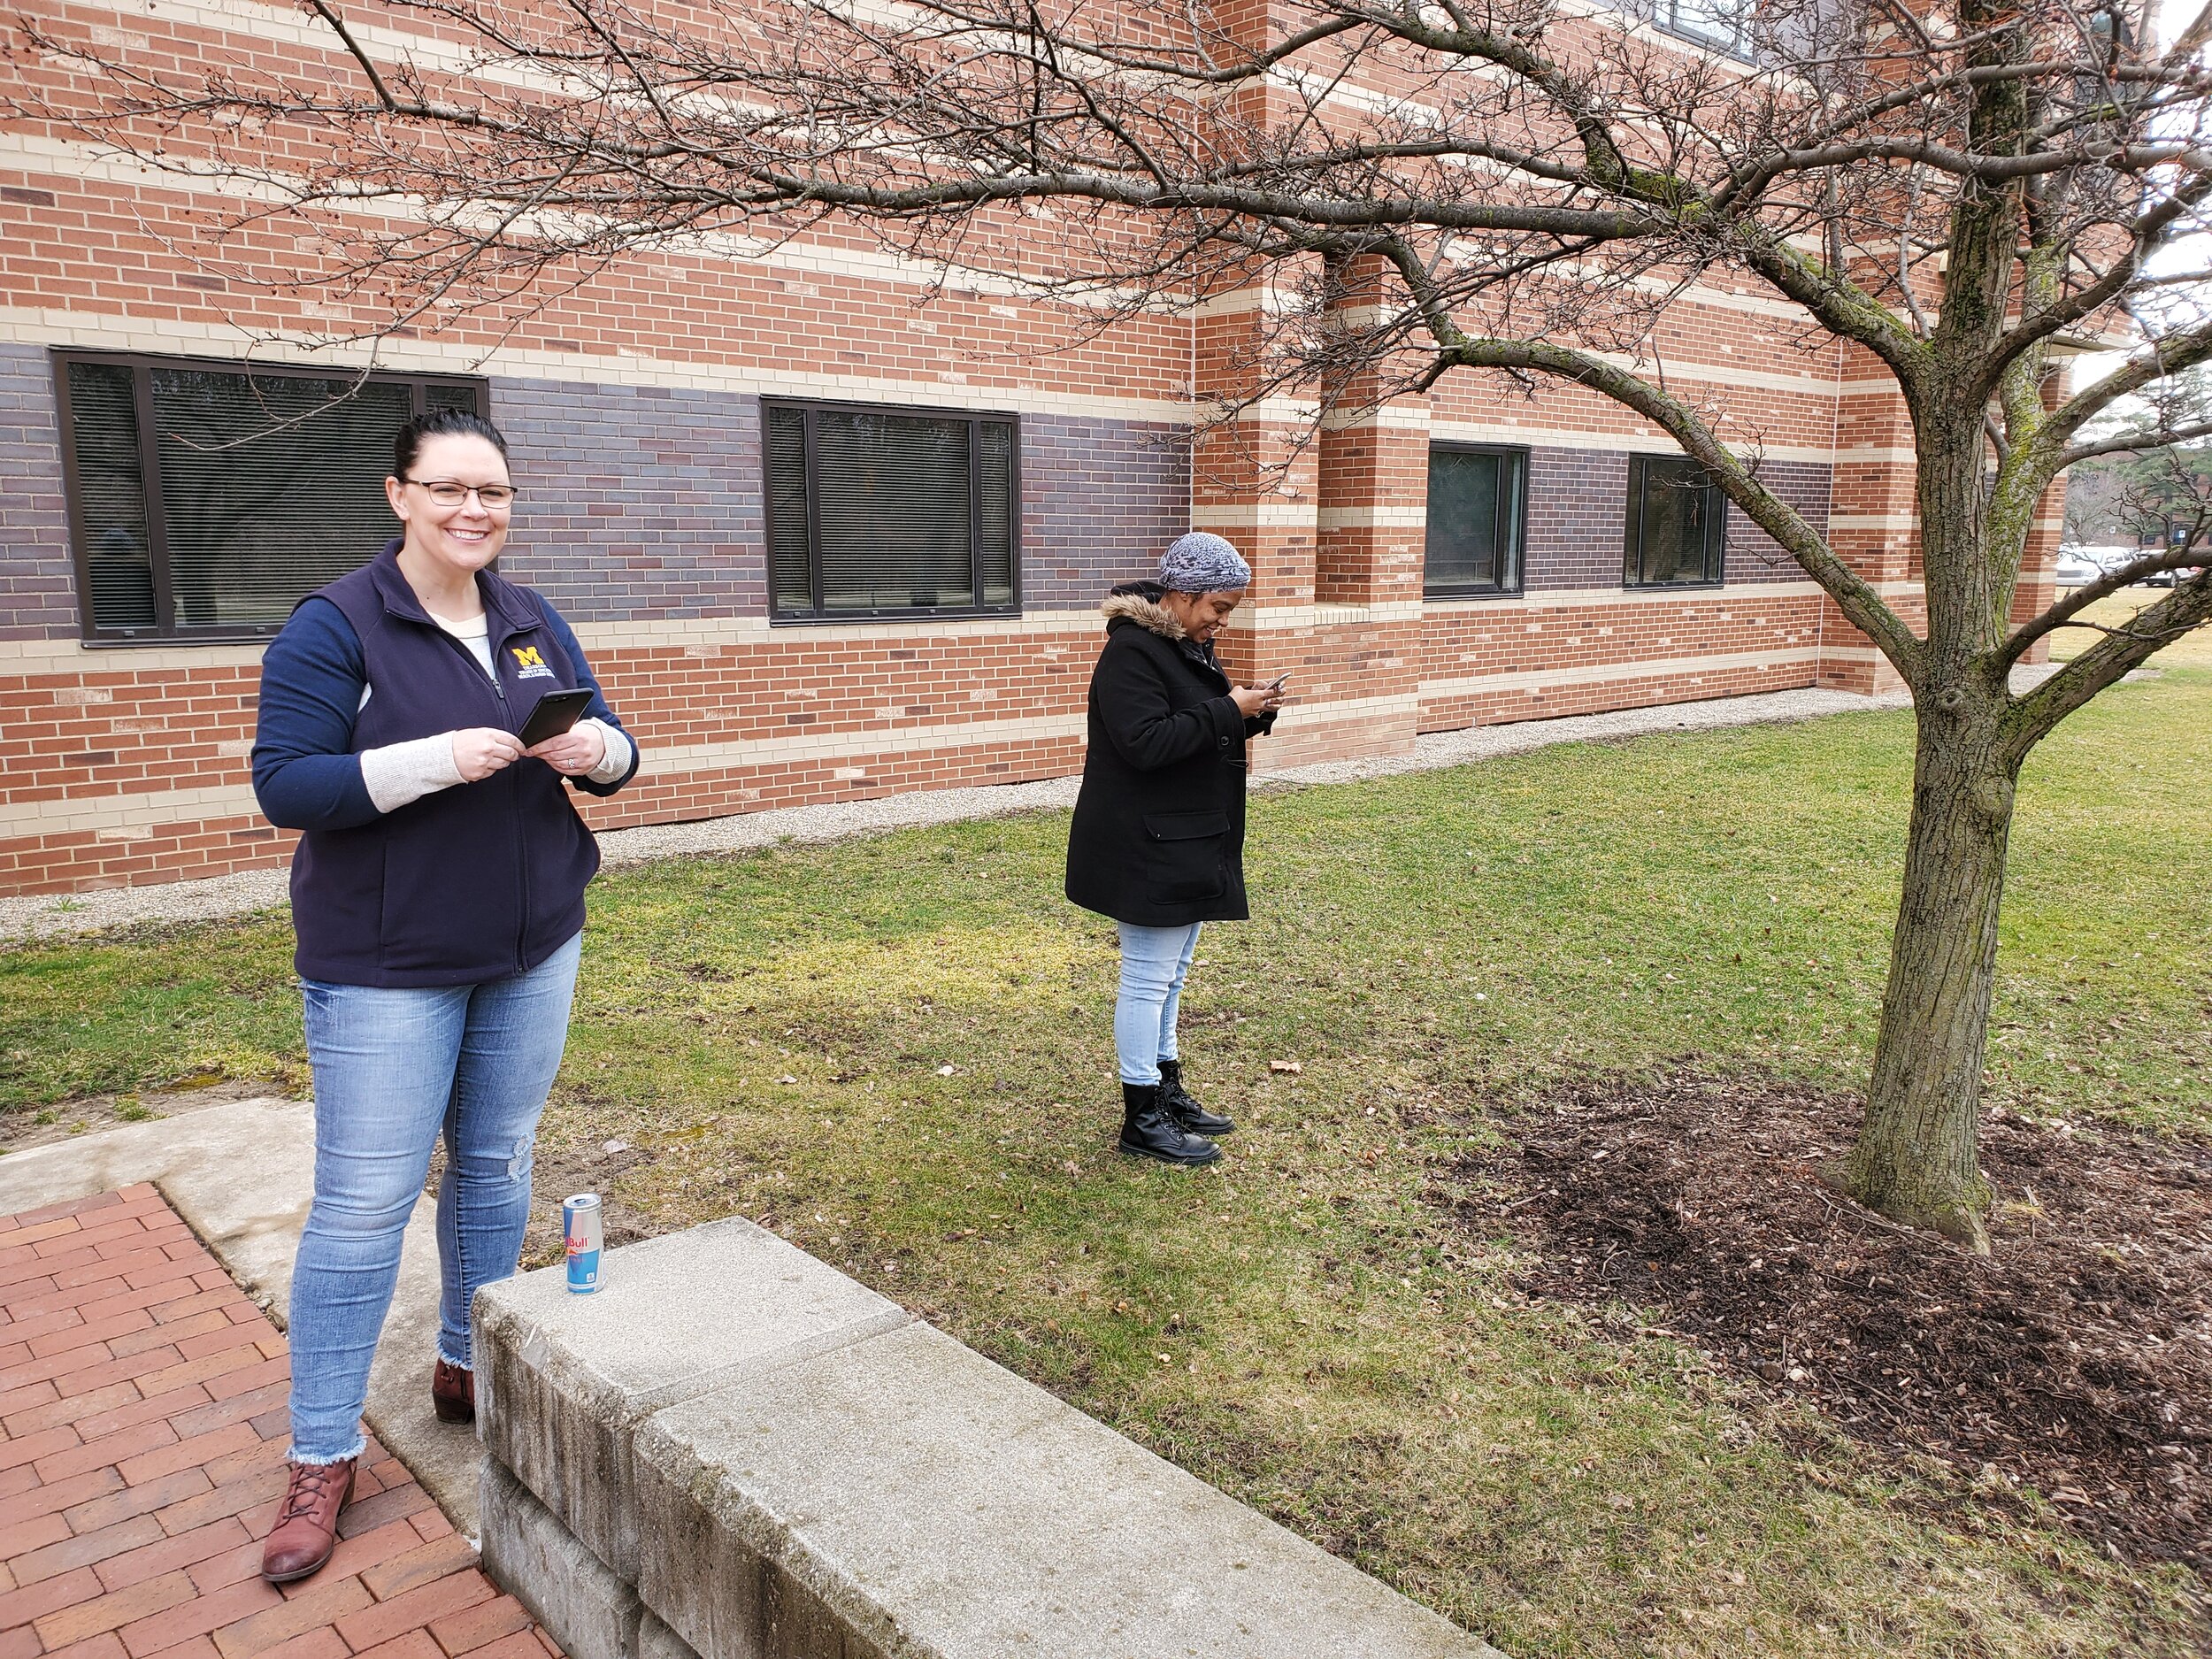 One of the most helpful components was a
  Note that non-profit organizations receive a 20% discount off this Professional license. This license also affords you many more benefits than the previous free license. For example, the free license gave you 50Mb of cloud storage space while the Professional plan gives you 500Mb. It also allows you to set permissions on your datasets to make them private. It also gives you email and online support.If that price is beyond your organizations budget you will notice that directly below the pricing plan is a section covering FREE Plans for Students and Great Causes!
  Carto has a grant program. You can read about this program